12 Ecommerce Customer Support KPIs That Predict Retention (2026)
The 12 ecommerce customer support KPIs that predict retention in 2026 are: First Response Time (FRT), First Contact Resolution (FCR), Customer Satisfaction Score (CSAT), Net Promoter Score (NPS), Average Resolution Time (ART), Ticket Volume Per Order, Customer Effort Score (CES), Resolution Quality Score, Repeat Contact Rate, Tickets Per Agent Per Day, Cost Per Ticket, and Support-Driven Repeat Purchase Rate. Track FRT, FCR, CSAT, and NPS first — they have the strongest retention prediction power for US ecommerce brands.
Most US ecommerce brands track the wrong customer support numbers.
Total tickets closed. Average response time. A CSAT score on a dashboard nobody opens. These look fine on a Monday morning report. Then churn climbs and nobody knows why.
Here’s what your helpdesk dashboard won’t show you: repeat customers make up just 21% of the average ecommerce customer base, but they generate 44% of total revenue. Lose them and no amount of ad spend will plug the hole.
This guide is the operator’s shortlist. The 12 ecommerce customer support KPIs that actually predict retention for US brands in 2026 — with formulas, US benchmarks, what each one predicts, when it lies, and exactly how to fix it.
If you run a Shopify, DTC, or marketplace brand at real volume, this is the dashboard you should be running.
What Are Ecommerce Customer Support KPIs?
Ecommerce customer support KPIs are measurable signals that show whether your support team is protecting revenue, fixing real problems, and keeping customers coming back. The right KPIs predict retention before churn shows up in your revenue numbers.
For US ecommerce brands in 2026, support is no longer a cost center. Companies that treat customer service as a value driver see 3.5x higher revenue growth — and they only spend 0.5% more of revenue on support. The difference is what they track and act on.
Quick Reference: All 12 Customer Support KPIs at a Glance
[IMAGE PLACEMENT — Infographic]: Convert this table into a downloadable PDF infographic.
#
KPI
Formula
US Benchmark (2026)
Top Performer
Tier
1
First Response Time (FRT)
Sum of first response times ÷ tickets
Under 1 hour
Under 1 minute (chat)
🔴 Tier 1
2
First Contact Resolution (FCR)
(Resolved on first contact ÷ total) × 100
70-75%
80%+
🔴 Tier 1
3
Customer Satisfaction (CSAT)
(Positive responses ÷ total) × 100
75-82%
90%+
🔴 Tier 1
4
Net Promoter Score (NPS)
% Promoters − % Detractors
30-50 (B2C)
70+
🔴 Tier 1
5
Average Resolution Time (ART)
Total resolution time ÷ resolved tickets
Under 4 hrs (email)
Under 1 hr
🟡 Tier 2
6
Ticket Volume Per Order (TPO)
(Tickets ÷ orders) × 100
5-10%
Under 5%
🟡 Tier 2
7
Customer Effort Score (CES)
Avg of “How easy was it?” (1-7)
5.5+
6.0+
🟡 Tier 2
8
Resolution Quality Score
Internal QA audit rubric
Above 90%
95%+
🟡 Tier 2
9
Repeat Contact Rate
(2+ contacts on same issue ÷ total) × 100
Below 15%
Under 8%
🟢 Tier 3
10
Tickets Per Agent Per Day
Resolved ÷ agents ÷ working days
25-60 (channel-dependent)
70+ (email)
🟢 Tier 3
11
Cost Per Ticket
Total support costs ÷ tickets
$5-$12 (US)
$2-$4 (offshore)
🟢 Tier 3
12
Support-Driven Repeat Purchase Rate
(Repurchased in 90 days ÷ contacts) × 100
35%+
50%+
🟢 Tier 3
Tier 1 = Strongest retention prediction. Start here. Tier 2 = Tells you if your team actually fixes things. Tier 3 = Tells you if your support operation can scale.
Why These KPIs Predict Retention (And Most US Brands Miss This)
Support is the last touchpoint before a customer decides to come back or quietly disappear. The data is brutal and consistent:
Sub-one-hour responses drive 71% retention vs 48% for 24-hour responses
Customers with excellent service experiences show 87% retention vs 41% for poor experiences
A 5% increase in customer retention boosts profits 25-95%
88% of customers expect faster responses than a year ago
Every 1% improvement in FCR cuts operating costs by 1%
The pattern is clear. Speed matters. Quality matters more. And the brands winning right now measure both with the right KPIs.
Tier 1: The 4 KPIs With The Strongest Retention Signal
These four are non-negotiable. If you only track four metrics, make it these.
1. First Response Time (FRT)
Quick answer: First Response Time is how long a customer waits for the first human reply. The 2026 US benchmark is under 1 hour for email and under 1 minute for live chat.
Formula:
FRT = Sum of all first response times ÷ Total tickets
US Benchmarks by Channel (2026):
Channel
Industry Average
Best-in-Class
Customer Expectation
Live Chat
2-3 minutes
Under 1 minute
Under 1 minute
Phone
30-60 seconds
Under 20 seconds
Under 30 seconds
Email
4-6 hours
Under 1 hour
Under 1 hour
Social Media
4-8 hours
Under 1 hour
Under 30 minutes
SMS/Text
15-30 minutes
Under 5 minutes
Under 5 minutes
What it predicts: Direct retention. 68% of customers who receive a response within one hour become repeat buyers. 59% are more likely to buy when their question is answered in under a minute.
When it lies: If your auto-responder counts as “first response,” your FRT looks great while customers feel ignored. Brands that game FRT with auto-replies often see CSAT crash a quarter later.
How to fix FRT:
Track human FRT separately from auto-replies
Set channel-specific SLAs
Build 24/7 coverage (offshore dedicated teams are the cheapest path)
Use AI for first-touch on common questions like order status
2. First Contact Resolution (FCR)
Quick answer: First Contact Resolution is the percentage of tickets resolved in a single interaction. The 2026 US benchmark for ecommerce is 70-75%. FCR is the strongest single predictor of customer retention.
Formula:
FCR = (Tickets resolved on first contact ÷ Total tickets) × 100
US Benchmark (2026): 70-75% for top ecommerce brands. Below 60% means trouble.
What it predicts: This is the single strongest retention signal in support. A customer who gets their issue fixed once trusts you. A customer bounced between agents loses faith fast. According to SQM Group research, every 1% improvement in FCR cuts operating costs by 1% AND improves CSAT by 1%. That’s a rare two-for-one in customer service.
When it lies: If your team closes tickets quickly to hit FCR, customers may open new tickets the next day. Always pair FCR with Repeat Contact Rate (KPI #9).
How to fix FCR:
Audit your top 5 ticket types (where’s my order, returns, refunds, sizing, defective product)
Build canned responses and one-click resolutions for each
Give agents authority to refund or replace without manager approval
Most US brands can lift FCR by 15-20 points just by removing approval bottlenecks
Struggling to maintain FCR as you scale? AcquireX builds dedicated customer support teams trained on your products, your processes, and your KPIs. See how our customer service management works →
3. Customer Satisfaction Score (CSAT)
Quick answer: CSAT is a direct rating from customers after a support interaction, usually on a 1-5 scale. The 2026 ecommerce average is 75-82%, with top brands hitting 90%+.
Formula:
CSAT = (Number of satisfied responses ÷ Total responses) × 100
Most brands count 4-5 (or 6-7 on a 7-point scale) as “satisfied.”
US Benchmark (2026): 75-82% ecommerce average. Top brands hit 90%+. Below 70% signals a serious quality problem.
Channel-specific CSAT (2026):
Phone support: 91% (highest)
Live chat: 85%
Email: 78-82%
Self-service: 65-70%
What it predicts: Short-term retention. A 5-star CSAT customer is highly likely to buy again in the next 30 days.
When it lies: CSAT only captures customers who reply. Quiet, unhappy buyers don’t fill out surveys. They just leave. If your response rate drops below 15%, the score isn’t trustworthy.
How to fix CSAT:
Trigger surveys after support tickets AND after delivery
Delivery experience often shapes satisfaction more than support
Track response rate alongside the score
Phone support consistently scores 6-13 points higher than email — if you don’t offer phone, that’s a CSAT gap
4. Net Promoter Score (NPS)
Quick answer: Net Promoter Score measures how likely customers are to recommend your brand on a 0-10 scale. The 2026 B2C ecommerce average is 30-50, with top performers above 70.
Formula:
NPS = % Promoters (9-10) − % Detractors (0-6)
US Benchmark (2026):
Average B2C ecommerce: 30-50
Top performers: 70+
Subscription/beauty/pet brands: Often 60-75
Furniture/electronics: Often 40-55
What it predicts: Long-term retention and word-of-mouth growth. Bain & Company research shows NPS is the strongest predictor of long-term loyalty and revenue growth. High-NPS shoppers buy 3-4x more often than detractors.
When it lies: Customers rate based on the latest interaction. One bad shipping experience can tank your NPS even when your product is great. NPS is also a lagging indicator — it tells you the overall health, not what’s broken right now.
How to fix NPS:
Send NPS after the 2nd or 3rd purchase, not the first — you’ll get a truer loyalty signal
Always pair with “What’s the main reason for your score?” to get actionable data
Don’t survey too often. NPS fatigue is real
Combine with CSAT — CSAT diagnoses problems, NPS tracks the relationship
Tier 2: The 4 Quality KPIs — Is Your Team Actually Fixing Things?
These metrics tell you whether your support team is solving real problems or just closing tickets.
5. Average Resolution Time (ART)
Quick answer: Average Resolution Time tracks the total time from ticket open to full resolution. The 2026 US benchmark is under 4 hours for email and under 48 hours for complex issues.
Formula:
ART = Sum of all resolution times ÷ Total resolved tickets
US Benchmarks (2026):
Simple issues (order status, account questions): Under 4 hours
Complex issues (returns, refunds, disputes): Under 48 hours
Returns/refunds: Under 24 hours
Phone calls: Under 6 minutes
Email: Under 8-12 hours average, top performers under 4 hours
What it predicts: Whether your team can close loops, not just open them. ART has a direct impact on CSAT — the longer an issue drags on, the more frustrated the customer becomes.
When it lies: ART can look fine while customers wait through 3 different agents. Pair with FCR.
How to fix ART:
Map your top 10 issue types
Set a max ART for each category
If a category blows past it twice in a week, that’s a process problem
Track ART weekly, especially during peak season when times spike
6. Ticket Volume Per Order (TPO / Contact Rate)
Quick answer: Tickets Per Order measures how many support tickets you generate per 100 orders. The healthy US benchmark is 5-10%. Above 15% means something in your product, shipping, or listing is broken.
Formula:
TPO = (Total tickets ÷ Total orders) × 100
US Benchmark (2026): 5-10% is healthy. Above 15% is a warning sign.
What it predicts: TPO is a forward-looking metric. It exposes silent problems before they hit CSAT or NPS. Instead of measuring how well you handle problems, TPO tells you how many problems you’re creating.
When it lies: A low TPO can mean great service OR your customers have given up on your support and are resolving issues through Amazon disputes, chargebacks, or angry social posts. Near-zero TPO with rising returns is the worst combination in ecommerce.
How to fix TPO:
Break it down by product category, shipping carrier, and customer segment
Two SKUs usually drive most of your tickets
Fix the listing, packaging, or product — not the support team
One carrier often causes 30-40% of tickets for furniture/heavy goods brands
7. Customer Effort Score (CES)
Quick answer: Customer Effort Score measures how hard customers had to work to get their issue resolved on a 1-7 scale. The 2026 benchmark is 5.5+. Customers with “easy” experiences are 4x more likely to repurchase.
Formula:
CES = Average response to: "How easy was it to resolve your issue?" (1-7 scale)
US Benchmark (2026): Above 5.5 out of 7. Cross-industry average is 5.99.
What it predicts:Gartner research shows that reducing customer effort is one of the most effective ways to increase retention. According to The Effortless Experience, 96% of high-effort customer experiences drive disloyalty. Effort predicts loyalty better than satisfaction does.
When it lies: CES can be high in self-service-heavy brands where customers never reach a human. That’s fine for simple issues but hides poor handling on complex ones.
How to fix CES:
Reduce steps in your return/refund flow
Pre-fill order info from email
Allow one-click refunds
Cut hold times
Audit your contact page — if customers can’t find help, effort spikes before they even start
8. Resolution Quality Score (Internal QA)
Quick answer: Resolution Quality Score is an internal QA audit of how well agents handled tickets. The benchmark is above 90% on a 10-point rubric. It catches problems before CSAT does.
Formula: Auditor reviews 5-10% of tickets weekly. Scores on accuracy, tone, completeness against a defined rubric.
US Benchmark (2026): Above 90%.
What it predicts: Whether your team is rushing. A team with high CSAT but low QA scores is getting lucky — that luck runs out.
When it lies: Internal QA becomes political if scored by the same person who hires the team. Rotate auditors quarterly.
How to fix Resolution Quality:
Build a 10-point rubric (accuracy 3 points, tone 3, completeness 3, policy 1)
Score 5-10% of tickets weekly
Coach, don’t punish
Tie scores to weekly training topics
Most brands skip this entirely — that’s why their CSAT mysteriously crashes one quarter
Tier 3: The 4 Scaling KPIs — Can Your Support Operation Grow?
These KPIs tell you whether your support function can scale with the business or break at the next growth milestone.
9. Repeat Contact Rate
Quick answer: Repeat Contact Rate is the percentage of customers who contact you about the same issue more than once. The benchmark is below 15%. Customers forced to contact you twice for the same problem are 3x more likely to leave.
Formula:
Repeat Contact Rate = (Customers with 2+ tickets on same issue ÷ Total customers with tickets) × 100
US Benchmark (2026): Below 15%. Top brands stay under 8%.
What it predicts: Hidden churn. The pairing with FCR is critical — if FCR looks good but Repeat Contact Rate is high, you’re closing tickets prematurely.
When it lies: Easy to game by closing tickets early. Cross-check with FCR.
How to fix Repeat Contact Rate:
Tag every ticket by root issue type
When you see 3+ tickets on the same issue, escalate to a process fix
Don’t just train the agent — fix the root cause
10. Tickets Per Agent Per Day (Productivity)
Quick answer: Tickets Per Agent Per Day measures daily throughput. US benchmarks: 40-60 for email-only, 25-40 for mixed channels, 15-25 for phone-heavy teams.
Formula:
Productivity = Total tickets resolved ÷ Number of agents ÷ Working days
US Benchmarks (2026):
Email-only: 40-60 tickets/day
Mixed channels: 25-40 tickets/day
Phone-heavy: 15-25 tickets/day
AI-assisted human teams: 60-90 tickets/day (climbing fast)
What it predicts: Whether you have enough team to handle scale, or whether agents are burning out.
When it lies: Pure throughput ignores complexity. An agent handling 60 simple “where’s my order” tickets isn’t better than one handling 25 returns disputes.
How to fix productivity:
Weight tickets by complexity
Track productivity by ticket type, not just total volume
Watch for burnout signals: rising AHT, dropping CSAT, increased sick days
AI assistance can lift this 40-60% without burning out humans
11. Cost Per Ticket
Quick answer: Cost Per Ticket is what each customer interaction costs your business. The 2026 US range is $5-$15 for in-house teams, $2-$4 for offshore dedicated teams, and $0.50-$3 for AI-resolved tickets.
Formula:
Cost Per Ticket = Total support costs (salary + tools + infrastructure + management) ÷ Total tickets resolved
What it predicts: Whether your support function is sustainable as you scale.
When it lies: Cheap support that doesn’t retain customers is more expensive than premium support that does. Always pair cost per ticket with retention rate. A $4 ticket that loses the customer is more expensive than a $10 ticket that keeps them.
How to fix cost per ticket:
Don’t optimize for lowest cost per ticket
Optimize for lowest cost per retained customer
Most stores miss training, management overhead, QA, and turnover costs in their math — true cost is usually 2-3x what they think
12. Support-Driven Repeat Purchase Rate
Quick answer: Support-Driven Repeat Purchase Rate tracks the percentage of customers who buy again within 90 days of contacting support. The 2026 benchmark is above 35%. This metric ties every other KPI to actual revenue.
Formula:
Support-Driven Repeat Rate = (Customers who repurchased within 90 days ÷ Customers who contacted support) × 100
US Benchmark (2026): Above 35%. Top brands hit 50%+.
What it predicts: This is the closing-the-loop metric. It connects every other KPI on this list to actual revenue.
When it lies: It doesn’t, really. But it’s a lagging indicator. Use it to validate the rest, not to react in real time.
How to fix:
Segment by issue type
If returns customers repurchase at 50% but shipping-issue customers repurchase at 15%, you have a shipping problem worth fixing today
Tired of tracking these KPIs manually with a team that doesn’t own the outcome? AcquireX builds dedicated offshore support teams that work against these exact metrics. Not vendors. Not freelancers. A real team embedded in your operation. Talk to our team →
How AI Is Changing Customer Support KPIs in 2026
The benchmarks above are shifting fast. AI isn’t just helping US ecommerce brands hit their KPIs — it’s redefining what “good” looks like for several of them. Here’s what every US brand needs to know.
The AI Impact on Each KPI
KPI
2024 Benchmark
2026 With AI
Change
FRT (chat)
2-3 minutes
Under 5 seconds
96% faster
FRT (email)
4-6 hours
Under 10 minutes
95% faster
FCR
65-70%
75-85% (AI-assisted)
+10-15 points
Cost Per Ticket
$6-$15
$1-$3 (AI), $5-$12 (hybrid)
50-80% reduction
Tickets Per Agent/Day
25-40
60-90 (AI-assisted)
2x throughput
Key 2026 AI Customer Service Stats Every US Brand Should Know
80% of routine customer interactions are now handled by AI
Salesforce reports 30% of service cases are resolved by AI today, with a projection of 50% by 2027
AI chatbots resolve 75% of customer queries without human intervention (Juniper Research)
AI reduces first response times by 37-97% — Klarna cut average resolution from 11 minutes to 2 minutes (82% improvement)
Cost per AI interaction averages $0.50 vs $6+ for human agents
Mid-market ecommerce brands are adopting AI chatbots at 3x the rate of small or enterprise
AI-resolved tickets have an 11.3% re-contact rate within 72 hours vs 8.7% for human-resolved — meaning AI doesn’t always resolve cleanly
What This Means for Your KPI Dashboard
If you’re a US ecommerce brand in 2026, two new KPIs are emerging:
AI Deflection Rate: The percentage of tickets fully handled by AI without human help.
Median for enterprise: 41.2%
Top quartile: 58.7%
Ecommerce sweet spot: 50-65%
AI Escalation Accuracy: Whether the AI routes complex issues to the right human.
Median AI-to-human escalation rate: 22%
Best programs use confidence-based + sentiment-based escalation triggers
When AI Helps Your KPIs (And When It Hurts)
AI helps when:
You have high-volume, repetitive queries (order status, returns, sizing)
Tickets have structured data the AI can pull (order info, shipping status)
The customer just needs information, not empathy
AI hurts when:
You’re handling refund disputes (CSAT drops with pure-AI)
The customer is emotionally distressed
You haven’t trained it on your specific product catalog
You’re using basic chatbots instead of modern LLM-powered agents (3-5x lower resolution rate)
The hybrid model wins: Programs running AI for tier-1 + humans for complex issues report 4.25/5 CSAT at 71% lower blended cost-per-resolution vs all-human. Pure-AI programs trade a 0.20 CSAT gap for marginal extra savings — most US CX leaders no longer consider that worth it.
Customer Support KPI Benchmarks by Ecommerce Vertical
Not every benchmark applies equally. Here’s how the numbers shift by US ecommerce vertical:
Vertical
FRT
FCR
CSAT
Contact Rate
NPS
DTC Apparel
Under 2 hrs
65-70%
80%
8-12%
50-60
Beauty/Skincare
Under 1 hr
70-75%
85%
6-10%
60-70
Supplements/Health
Under 4 hrs
70-75%
84%
4-8%
55-65
Home & Furniture
Under 4 hrs
60-65%
78%
10-15%
45-55
Electronics
Under 2 hrs
65-70%
80%
12-18%
50-60
Subscription Box
Under 1 hr
75-80%
88%
3-6%
65-75
Marketplace (Amazon)
Under 12 hrs
70-75%
4.7+ stars
5-8%
N/A
Pet Supplies
Under 2 hrs
75-80%
87%
5-8%
60-70
Key insight: Apparel and home goods have naturally higher contact rates due to sizing and damage. Don’t aim for “industry average” — aim for the top quartile in your vertical.
CSAT vs NPS vs CES: Which Customer Support Metric Matters Most?
Quick answer: Track all three at different cadences. NPS predicts long-term loyalty, CSAT catches operational problems immediately, and CES is the strongest predictor of repeat purchase behavior.
Metric
Measures
Predicts
Track Frequency
Best For
CSAT
Single interaction satisfaction
Short-term retention (30 days)
After every ticket
Operational fixes, agent coaching
NPS
Long-term loyalty & advocacy
Long-term revenue growth
After 2nd-3rd purchase
Strategic decisions, retention forecasting
CES
Effort to resolve issue
Repeat purchase behavior
After complex issues
Reducing friction in support flow
If you can only track one for ecommerce retention prediction:
NPS wins for long-term loyalty prediction
CSAT wins for catching operational problems before they kill retention
CES wins for predicting whether the next purchase happens
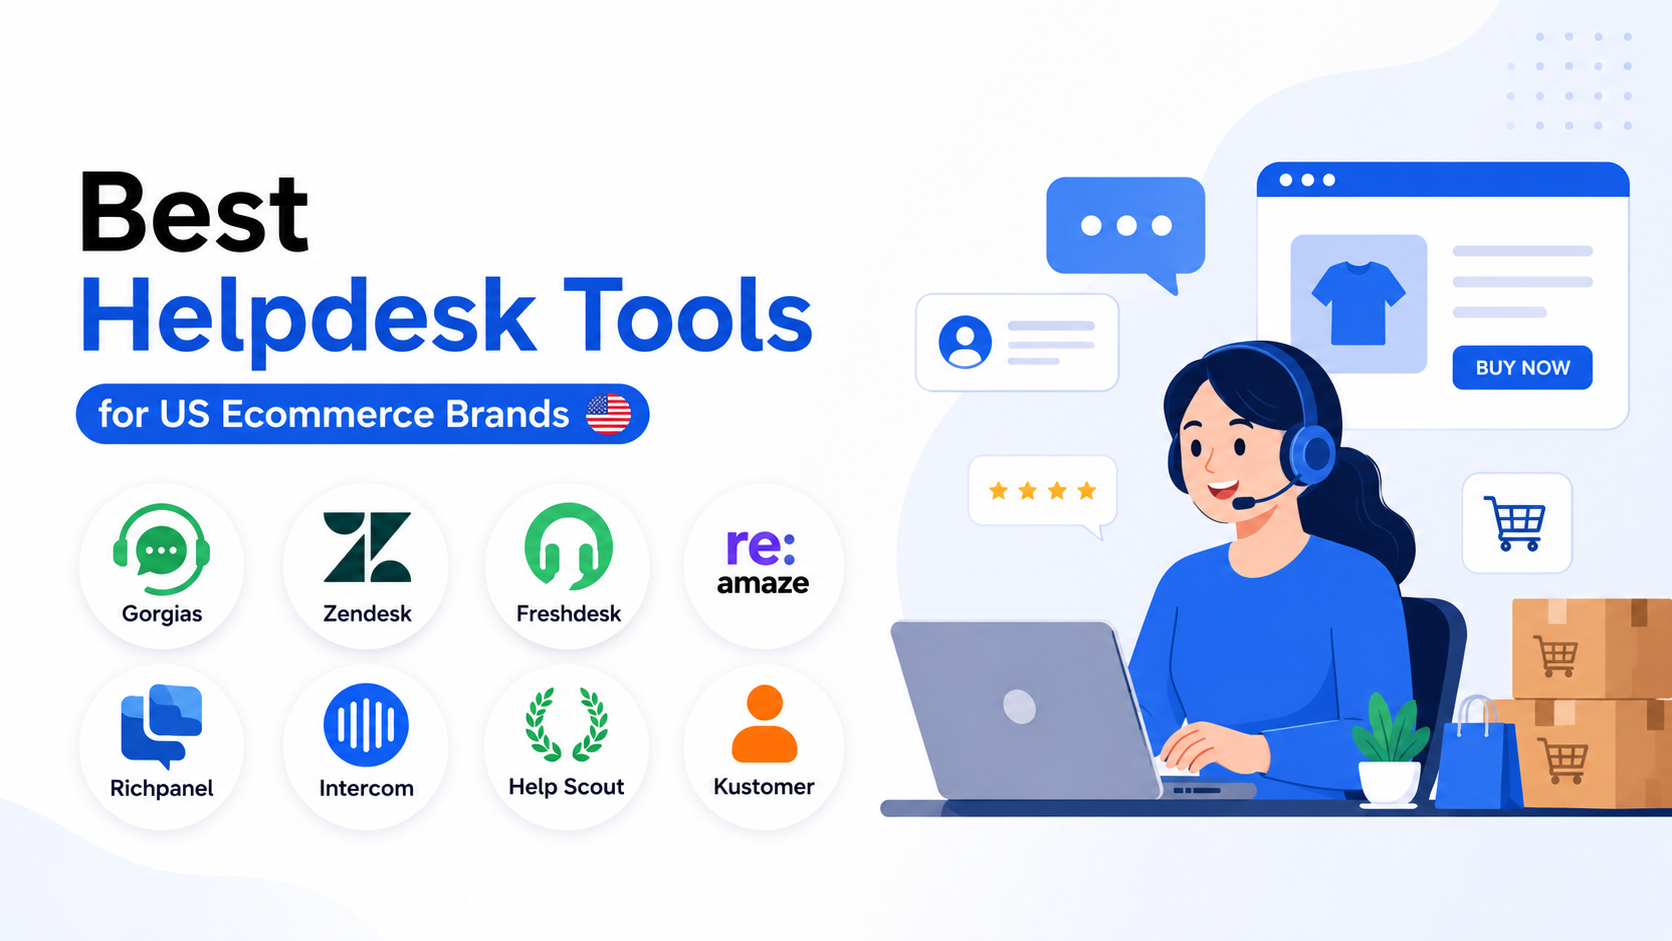
Best Helpdesk Tools for US Ecommerce Brands (2026)
The KPIs above are only as good as the tool you use to track them. Here’s the current landscape:
Tool
Best For
Starting Price (2026)
Built-in KPI Tracking
Gorgias
Shopify DTC brands
$50/month
CSAT, FRT, ART, ticket volume
Zendesk
Mid-market to enterprise
$55/agent/month
All 12 KPIs
Freshdesk
Budget-conscious teams
$15/agent/month
FRT, FCR, CSAT, NPS
Re:amaze
Shopify/BigCommerce
$29/agent/month
CSAT, FRT, ART
Richpanel
High-volume DTC
$300/month
CSAT, FRT, FCR, NPS
Intercom
Tech-forward brands with AI
$74/seat/month
AI deflection + standard KPIs
Help Scout
Email-heavy support
$20/user/month
FRT, ART, CSAT
Kustomer
Enterprise omnichannel
Custom pricing
Full suite + custom KPIs
Tool selection rule: If your brand is doing under $5M/year, start with Gorgias or Re:amaze. From $5M-$50M, Zendesk or Richpanel. Above $50M, evaluate Kustomer or Salesforce Service Cloud.
How to Build Your Customer Support KPI Dashboard (Without Overwhelming Your Team)
You don’t need 12 metrics on screen every day. Here’s the cadence that actually works:
Daily Review:
First Response Time (FRT)
CSAT
Ticket Volume
Weekly Review:
First Contact Resolution (FCR)
Repeat Contact Rate
Average Resolution Time (ART)
Monthly Review:
NPS
Cost Per Ticket
Support-Driven Repeat Purchase Rate
Quarterly Review:
Resolution Quality Score
Full KPI trend analysis
Vertical benchmark comparison
The fastest US ecommerce teams catch issues within 7 days of a change. The slow ones find out 90 days later when revenue drops.
Track These KPIs in 30 Days: A Practical Framework for US Brands
Implement ticket tagging by issue type (shipping, product, returns, sizing, billing, other)
Train your team to tag every single ticket
This is the foundation for every diagnostic decision later
Week 3 — Identify Worst Performer:
Compare your 5 metrics to vertical benchmarks
Pick the one with the biggest gap
Build a single 30-day improvement plan for that metric only
Week 4 — Build Your Pairing Dashboard:
For each KPI, add its counter-metric
Set up weekly review meetings
Track the worst-performer metric daily until it improves 10%
After 30 days, you’ll have something most US ecommerce brands don’t: a real, working support KPI dashboard tied to retention outcomes.
The Pairing Rule: Why Every KPI Needs a Counter-Metric
A single number can lie. A pair almost never can. Here are the most useful pairings every US ecommerce brand should run:
If This Looks Good
Always Check This
FRT (response time)
FCR (did the response actually solve it?)
CSAT (satisfaction)
Repeat Contact Rate (did they come back?)
Tickets per agent (productivity)
Resolution Quality Score (was it done right?)
Cost per ticket (efficiency)
Support-Driven Repeat Purchase Rate (is it sustainable?)
Low ticket volume (calm)
Returns + chargebacks (silent unhappy customers?)
High NPS (loyalty)
Actual repeat purchase rate (does the score match behavior?)
High AI deflection (cost saving)
72-hr re-contact rate (did AI really resolve it?)
Run every metric next to its pair. You’ll catch dashboard lies before they become quarterly disasters.
What US Ecommerce Brands Get Wrong (And How To Fix It Fast)
Three patterns we see consistently in US brands doing $5M-$50M annually:
1. They Track FRT Religiously and Ignore FCR
Fast responses that don’t fix anything just make customers angrier. Always pair them. A team hitting 15-minute FRT but 50% FCR is creating churn, not preventing it.
2. They Don’t Tag Tickets by Issue Type
Without tagging, you can’t tell if you have a product problem, a shipping problem, or a listing problem. Tag everything from day one. Most US brands discover that 2-3 product lines or one shipping carrier drives an outsized share of ticket time once they start tagging properly.
3. They Treat Support as a Cost Center
Companies that treat customer service as a value driver see 3.5x higher revenue growth. The math is on retention, not on cutting headcount. If you’re constantly cutting support to save money, you’re paying for new customers to replace the ones you’re losing — which costs 4-5x more than retaining them.
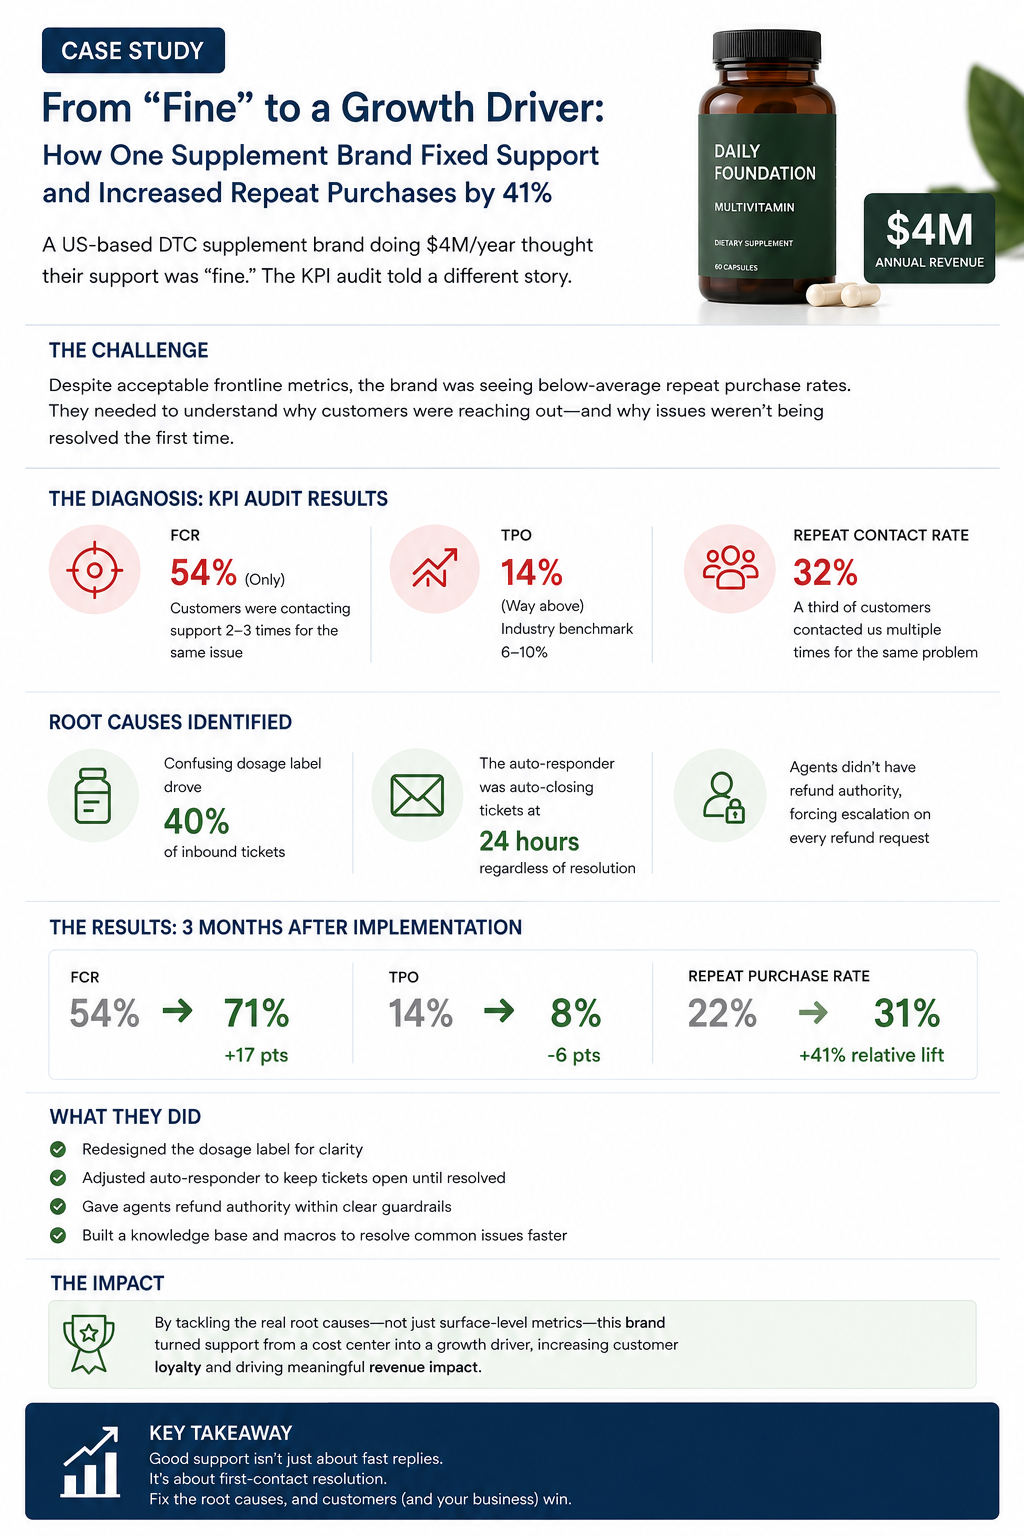
A Case Study: How One US DTC Supplement Brand Fixed Their Numbers
A US-based DTC supplement brand doing $4M/year had:
FRT: 6 hours (looked acceptable)
CSAT: 78% (industry-average)
Repeat purchase rate: 22% (below average)
They thought their support was “fine.”
When the full KPI audit ran, the real problems emerged:
FCR was only 54% — customers were contacting support 2-3 times for the same issue
TPO was 14% — way above their vertical’s 6-10% benchmark
Repeat Contact Rate was 32% — meaning a third of customers contacted them multiple times for the same problem
The actual root causes:
A confusing dosage label drove 40% of inbound tickets
The auto-responder was auto-closing tickets at 24 hours regardless of resolution
Agents didn’t have refund authority, forcing escalation on every refund request
Three months after fixing these: FCR climbed to 71%, TPO dropped to 8%, and repeat purchase rate moved from 22% to 31%.
They didn’t need more agents. They needed the right KPIs.
Frequently Asked Questions
What is the most important customer support KPI for ecommerce retention?
First Contact Resolution (FCR) is the single strongest retention signal. A customer whose issue gets fixed the first time is 3-4x more likely to buy again than one bounced between agents. Pair it with First Response Time for the strongest baseline. Every 1% improvement in FCR cuts operating costs by 1% AND boosts CSAT by 1%.
What is a good CSAT score for ecommerce in 2026?
The US ecommerce CSAT average is 75-82%, with top brands hitting 90%+. Below 70% signals a serious support quality problem. Phone support consistently scores highest at 91%, followed by live chat at 85% and email at 78-82%. Top-performing verticals: subscription boxes (88%), pet supplies (87%), and beauty (85%).
What is a good NPS for US ecommerce brands?
The B2C ecommerce average NPS is 30-50. Anything above 50 is healthy, and above 70 means you have strong brand advocates. Top DTC brands in beauty and pet supplies routinely score 70+, while apparel and electronics sit in the 50-60 range.
How many KPIs should a small ecommerce brand track?
Start with 5 KPIs from Tier 1: FRT, FCR, CSAT, NPS, and Repeat Contact Rate. Adding more before nailing the basics dilutes focus. Research shows top-performing ecommerce brands track an average of 5-7 core metrics. A dashboard with 5 well-chosen KPIs reviewed weekly outperforms one with 30 KPIs reviewed monthly.
What’s a good first response time for US ecommerce customers in 2026?
Under 1 hour for email, under 1 minute for live chat, under 20 seconds for phone, and under 5 minutes for SMS. 88% of customers expect faster responses than a year ago, and sub-1-hour responses retain customers at 71% vs 48% for 24-hour responses.
CSAT vs NPS: which matters more for ecommerce retention?
Both matter for different timeframes. CSAT predicts short-term retention (next 30 days) and surfaces operational problems immediately. NPS predicts long-term loyalty and word-of-mouth growth. If you can only track one, NPS wins for long-term retention prediction; CSAT wins for catching problems before they hurt retention. Most top brands track both.
How do I calculate customer retention rate from support metrics?
Customer Retention Rate = ((Customers at end of period − New customers acquired) ÷ Customers at start of period) × 100. The US ecommerce average is around 30%, meaning 70% of customers buy once and never come back. Support metrics like FCR, CSAT, and Repeat Contact Rate are leading indicators — when they trend negatively, retention drops in 30-60 days.
Should I outsource ecommerce customer support to AI or a dedicated team?
Both, depending on volume. Use AI for tier-1 repetitive queries (order status, returns, sizing) where it resolves 75-85% of tickets at $1-$3 each. Use a dedicated offshore team for complex issues, escalations, and customer relationships where humans win. The hybrid model delivers 4.25/5 CSAT at 71% lower cost than all-human support. Avoid pure-AI for refund disputes and emotional issues — CSAT drops fast.
What customer support KPIs do Amazon and marketplace sellers need to track?
Amazon-specific KPIs include: Order Defect Rate (target under 1%), Late Response Rate (under 10%), Buyer-Seller Messaging response time (under 24 hours per Amazon SLA), and 5-star review percentage. These overlap with FRT and CSAT but follow Amazon’s specific benchmarks. Marketplace sellers should also track A-to-Z claim rates as a churn indicator.
What is the difference between AI deflection rate and FCR?
AI deflection rate is the percentage of tickets fully handled by AI without human help (median 41.2% for enterprise programs). FCR is the percentage of tickets resolved in a single interaction, regardless of who handled it. A well-tuned AI program should have high deflection AND high FCR. Watch the 72-hour re-contact rate — AI-resolved tickets have an 11.3% re-contact rate vs 8.7% for human-resolved.
How often should I review customer support KPIs?
Daily: FRT, CSAT, ticket volume Weekly: FCR, Repeat Contact Rate, ART Monthly: NPS, Cost Per Ticket, Support-Driven Repeat Purchase Rate Quarterly: Resolution Quality Score, full benchmark review Review trends over 4-6 weeks before making process changes. One bad week is noise; three consecutive weeks is a pattern.
How much does customer support outsourcing cost for US ecommerce brands in 2026?
In-house US team: $8-$15 per ticket (including all costs) US-based agency: $6-$10 per ticket Offshore dedicated team: $2-$4 per ticket AI agents: $1-$3 per resolution The right model depends on volume and complexity. Brands doing $5M-$50M annually typically save 50-70% by moving to a dedicated offshore team while maintaining or improving CSAT.
How AcquireX Helps US Brands Build Retention-Driving Support
Most agencies treat support like a ticket queue. We don’t.
AcquireX’s customer service management for ecommerce builds a dedicated offshore team that owns your support KPIs the way your in-house team would. Not vendors. Not freelancers. A real team embedded in your operation.
What that looks like in practice:
KPI ownership. Your dedicated team works directly against the metrics in this article — FRT, FCR, CSAT, Repeat Contact Rate. We track them weekly and tell you what’s moving.
Issue tagging from day 1. Every ticket gets categorized so you can find product, shipping, and listing problems before they hit revenue.
AI-hybrid execution. We integrate AI for tier-1 deflection while our team handles the complex tickets that AI can’t — capturing the cost savings without the CSAT drop.
24/7 coverage without burning out US teams. Offshore dedicated teams give you sub-1-hour FRT without paying US labor rates for night shifts.
Marketplace expertise. If you sell on Amazon, our marketplace management services integrate directly with your support function to track buyer-seller messaging metrics.
The goal isn’t cheaper support. The goal is a support function that drives retention, not just closes tickets.
The Bottom Line
If you only do one thing after reading this:
Pick 3 KPIs from Tier 1. Pull last 30 days of data. Get a baseline today.
Add their counter-metrics. Don’t let dashboard lies fool you.
Pick the worst-performing one. Improve it by 10% before adding any new metrics.
Support isn’t a cost. It’s the cheapest retention lever you have.
Ready to Stop Closing Tickets and Start Driving Retention?
If you’re tired of managing vendors and want a dedicated team that actually owns these numbers, AcquireX builds the kind of customer support operation that turns first-time buyers into repeat customers.