Quick answer: A supplier scorecard is a monthly or quarterly report card that grades each factory, packaging vendor, freight forwarder and 3PL on the same weighted KPIs: quality, on-time-in-full delivery, landed cost accuracy, responsiveness and compliance. Ecommerce brands use it to pick which suppliers get more orders, which go on improvement plans, and where to qualify a backup.
Most supplier scorecard guides are written for manufacturers with ERP systems and procurement departments. An ecommerce brand looks different. You might buy from three factories in Asia, one packaging printer, a freight forwarder and a 3PL, and the person managing all of them is often also running the Amazon account. This guide shows how to build a scorecard that fits that reality: the right KPIs for physical-product ecommerce, a weighting model you can copy, scoring rules that avoid arguments, the spreadsheet formulas, and what to do with the results.
If you are still choosing suppliers rather than measuring existing ones, start with our ecommerce procurement and sourcing guide to cutting COGS, then come back here once purchase orders are flowing.
What is a supplier scorecard in ecommerce?
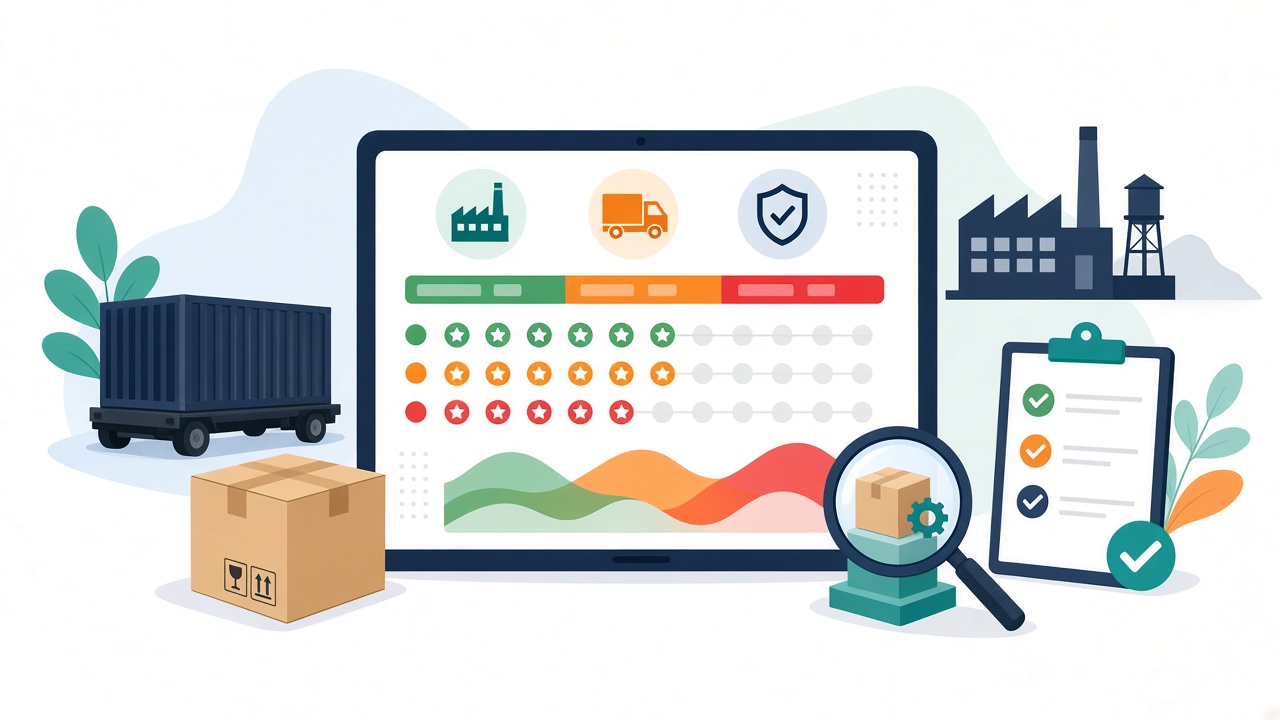
A supplier scorecard is a fixed set of performance metrics, each with a definition, a target, a weight and a scoring scale, applied to every supplier in a category on a regular schedule. The output is one comparable score per supplier per period, plus the trend over time.
In ecommerce the scorecard has a specific job. Your suppliers’ mistakes show up directly in front of customers: a defective batch becomes one-star reviews, a late container becomes a stockout that kills your marketplace ranking, and a mislabeled carton becomes an Amazon inbound problem. A scorecard turns those scattered problems into evidence you can act on before they compound.
A good scorecard does three things:
- Makes suppliers comparable. Two factories making the same SKU can be judged on the same numbers, not on who answers WhatsApp faster.
- Turns reviews into data conversations. “Your OTIF was 78% against a 95% target” lands better than “you’re always late.”
- Drives allocation decisions. Order volume, payment terms and new product launches go to the suppliers who earn them.
Why do ecommerce brands need a different scorecard than manufacturers?
Generic templates focus on parts-per-million defect rates, ERP invoice matching and audit findings. Those matter, but they miss how supplier performance actually hits an online brand. The table below shows the difference.
| Area | Typical manufacturing scorecard | What an ecommerce brand should add |
|---|---|---|
| Quality | Defect rate at receiving inspection | Quality-related return rate, defect mentions in reviews, pre-shipment inspection pass rate |
| Delivery | On-time delivery to the plant | OTIF against the PO ship date, ready-date accuracy, impact on stockout days |
| Cost | Price vs. market benchmark | Landed cost variance vs. quote, surprise charges, MOQ flexibility |
| Compliance | Certifications and audits | Marketplace labeling and prep compliance, carton and barcode accuracy, safety test documents |
| Service | Issue resolution time | Response time across time zones, sample turnaround, willingness to fix root causes |
The core idea is simple: measure suppliers on the outcomes your customers and marketplaces see, not only on what your warehouse sees.
Which supplier KPIs should an ecommerce scorecard track?
Keep it to six to ten KPIs. More than that and nobody, including you, will collect the data consistently. Here are the strongest candidates, grouped by category, with plain-language formulas.
Quality KPIs
- Pre-shipment inspection pass rate: inspections passed on first attempt ÷ total inspections. This is the earliest and cheapest quality signal you have.
- Defect rate at receipt: defective units found at your 3PL or warehouse ÷ units received.
- Quality-related return rate: returns coded as defective, damaged in packaging or not as described ÷ units sold from that supplier’s batches. This needs clean return reason codes, which our Shopify returns management guide covers in detail.
Delivery KPIs
- On-time-in-full (OTIF): POs shipped by the agreed date with the full quantity and correct SKUs ÷ total POs. Count a PO as a miss if it is late or short.
- Ready-date accuracy: how often the cargo-ready date the supplier gives you at PO confirmation holds within a tolerance you set (for example, plus or minus three days).
- Lead time consistency: the spread between the shortest and longest actual lead times this period. A predictable supplier with a longer lead time is often easier to plan around than a fast but erratic one, as explained in our demand forecasting and safety stock guide.
Cost KPIs
- Price adherence: invoices that match the agreed unit price ÷ total invoices.
- Landed cost variance: actual landed cost per unit vs. the landed cost you modeled at PO. Use the method in our landed cost and true COGS guide so freight, duties and fees are included.
- Commercial flexibility: a simple 1-5 rating for MOQ flexibility, payment terms and willingness to split shipments.
Compliance KPIs
- Labeling and packaging accuracy: shipments with correct barcodes, carton labels, carton dimensions and prep ÷ total shipments. For marketplace sellers this one protects your inbound performance and account health.
- Documentation on time: required documents (commercial invoice, packing list, test reports, certificates of conformity) received before departure ÷ shipments.
Service KPIs
- Response time: median business hours to a substantive reply, measured in the supplier’s working hours so time zones don’t penalize them unfairly.
- Corrective action closure: corrective actions closed by the agreed date ÷ corrective actions opened.
How should you weight supplier scorecard categories?
Weights should reflect what hurts your business most when it goes wrong. There is no universal split, and weights can differ by supplier type. A factory making your hero SKU should be weighted heavily on quality and delivery; a freight forwarder should be weighted on transit reliability and cost accuracy.
Use the table below as a starting point, not a rule.
| Supplier type | Quality | Delivery | Cost | Compliance | Service |
|---|---|---|---|---|---|
| Product factory (core SKUs) | 35% | 30% | 15% | 10% | 10% |
| Packaging and print vendor | 30% | 30% | 20% | 10% | 10% |
| Freight forwarder | 10% | 40% | 30% | 10% | 10% |
| 3PL or fulfillment partner | 30% (pick accuracy) | 30% (ship on time) | 15% | 10% | 15% |
Three rules keep weighting honest:
- Weights must sum to 100% per supplier type. If they don’t, scores across suppliers stop being comparable.
- Set weights before the period starts. Changing them after you see the results looks like moving the goalposts, and suppliers will notice.
- Revisit weights once or twice a year. If you move from DTC to heavy Amazon wholesale, compliance and labeling might deserve more weight.
If you use a 3PL, it deserves its own scorecard with pick accuracy, dock-to-stock time and ship-on-time rate. Our comparison of 3PL vs. in-house vs. hybrid fulfillment covers which metrics matter when you are evaluating that relationship.
How do you score each KPI without arguments?
The fastest way to ruin a scorecard is a vague scale. “Good” and “acceptable” mean different things to you and to a factory owner. Instead, define fixed thresholds that convert each raw result into a score from 1 to 5, and share them with the supplier in advance.
| Score | OTIF example threshold | Inspection pass rate example | Meaning |
|---|---|---|---|
| 5 | 98% or higher | 100% | Exceeds target |
| 4 | 95% to 97.9% | 95% to 99.9% | Meets target |
| 3 | 90% to 94.9% | 90% to 94.9% | Slightly below, watch |
| 2 | 80% to 89.9% | 80% to 89.9% | Needs a corrective plan |
| 1 | Below 80% | Below 80% | Unacceptable |
These thresholds are examples. Set yours based on your category, your customers’ expectations and what your best supplier can already do. The important part is that the thresholds are written down and do not change mid-period.
A few scoring rules that prevent disputes:
- Define the data source for each KPI. OTIF comes from the PO date and the forwarder’s cargo receipt, not from memory.
- Agree on exclusions upfront. Port closures or your own late artwork approval should not count against the supplier. Log them and exclude them consistently.
- Use a minimum sample. A supplier with one PO this quarter should get a “not enough data” flag rather than a 1 or a 5.
How do you calculate the weighted supplier score?
The math is simple: multiply each KPI score by its weight, then add them up. With a 1-5 scale and weights expressed as percentages that sum to 100, the formula is:
Overall score = Σ (KPI score × KPI weight) ÷ 100
The result is a number between 1 and 5. You can multiply it by 20 if you prefer a 0-100 view.
A worked example (illustrative numbers)
Here is a hypothetical factory that makes a brand’s best-selling SKU. The numbers are made up to show the calculation.
| KPI | Weight | Actual result | Score (1-5) | Weighted points |
|---|---|---|---|---|
| Inspection pass rate | 20% | 92% | 3 | 0.60 |
| Quality-related return rate | 15% | Below target | 4 | 0.60 |
| OTIF | 20% | 86% | 2 | 0.40 |
| Ready-date accuracy | 10% | Met 7 of 8 POs | 4 | 0.40 |
| Price adherence and landed cost variance | 15% | Within tolerance | 5 | 0.75 |
| Labeling and documentation | 10% | One carton label error | 3 | 0.30 |
| Response time and corrective actions | 10% | Fast, all actions closed | 5 | 0.50 |
| Total | 100% | 3.55 / 5 |
This supplier is cheap and communicative but unreliable on delivery and inconsistent on quality. The overall score alone (3.55) hides that, which is why you should always review category scores alongside the total.
Spreadsheet formulas you can copy
In Google Sheets or Excel, put weights in column B, scores in column D, and use:
=SUMPRODUCT(B2:B8, D2:D8)/100for the overall score.=IFS(E10>=4.2,"Preferred",E10>=3.5,"Approved",E10>=2.8,"Conditional",TRUE,"At risk")to assign a performance band.=IF(SUM(B2:B8)<>100,"Weights must total 100","OK")as a safety check.
What should you do with the scores?
A scorecard that doesn’t change decisions is just paperwork. Tie each performance band to a clear action so everyone, including the supplier, knows what a score means.
| Band (example cutoffs) | What it means | Action |
|---|---|---|
| Preferred (4.2 and above) | Reliable partner | First call for new SKUs, larger volume, better payment terms, quarterly business reviews |
| Approved (3.5 to 4.19) | Solid with gaps | Keep volume steady, agree one or two improvement targets |
| Conditional (2.8 to 3.49) | Material risk | Written corrective action plan with dates, tighter inspection, start qualifying a backup |
| At risk (below 2.8) | Hurting the business | Freeze new POs, move volume to backup, exit if no improvement in one or two periods |
One supplier in the “Conditional” band for a hero SKU is a business risk, not a procurement detail. That is usually the moment to qualify a second source, even at a slightly higher unit cost.
How often should you review supplier scorecards?
Match the cadence to how much a supplier matters and how often you order from them.
- Monthly: core product factories and your 3PL. These relationships move fast and problems compound quickly.
- Quarterly: packaging vendors, freight forwarders and secondary factories.
- Twice a year: low-volume or low-risk suppliers.

A 30-minute supplier review agenda
- Scores and trend (5 minutes): share the scorecard before the call so the meeting starts with questions, not surprises.
- Top two gaps (10 minutes): focus on the weakest categories and ask for root causes, not apologies.
- Corrective actions (10 minutes): agree on owners, dates and how you will verify the fix.
- Look ahead (5 minutes): share your forecast and upcoming launches. Suppliers who see your demand plan perform better.
Sharing the scorecard with suppliers is important. The best ones want to know where they stand, and many will improve simply because performance is now visible.
What are the most common supplier scorecard mistakes?
- Too many KPIs. Twenty metrics means nobody knows what matters. Start with six to eight.
- Measuring only what is easy. Unit price is easy to track; quality-related returns take more work but tell you far more.
- Scoring from memory. If a KPI can’t be pulled from POs, inspection reports, your 3PL or your returns data, either fix the data or drop the KPI.
- Not sharing results. A private scorecard helps you decide; a shared scorecard also changes supplier behavior.
- No consequences. If “At risk” suppliers keep getting the same volume, the scorecard loses credibility with your team and theirs.
- Ignoring your own role. Late artwork approvals, changing specs and short-notice POs hurt supplier scores. Track brand-caused delays too.
Should you build supplier scorecards in-house or outsource them?
The scorecard itself is a spreadsheet. The hard part is the ongoing work behind it: chasing ready dates, collecting inspection reports, coding returns, reconciling invoices against landed cost, and running monthly reviews across time zones. For a lean ecommerce team, that work is usually what gets dropped first.
| Option | Best for | Watch out for |
|---|---|---|
| Founder or ops manager runs it | One or two suppliers, early stage | Reviews slip when launches or sales events take priority |
| Sourcing agent | Brands that need eyes in the supplier’s country | Agents may be paid by factories, which can bias reporting |
| Procurement software | Larger supplier bases with clean ERP data | Overkill for most DTC brands, and still needs someone to run it |
| Dedicated offshore procurement team | Growing brands with several suppliers and SKUs | Needs clear SOPs and KPI definitions from the start |
Let AcquireX run your supplier performance program
AcquireX’s procurement and sourcing services give ecommerce brands a dedicated team that builds your supplier scorecards, collects the data every period, chases ready dates, coordinates inspections, reconciles landed cost and runs the supplier reviews for you. You get one clear report on which suppliers deserve more volume and which need a backup.
Want this tied into inventory and fulfillment too? Our ecommerce supply chain management team connects supplier performance to forecasting, freight and 3PL operations.
Book a call with AcquireX to see what a supplier scorecard program would look like for your catalog.
How do you launch a supplier scorecard in 30 days?
- Week 1, list and group suppliers. Separate factories, packaging, freight and 3PL. Rank them by spend and by how much revenue depends on them.
- Week 2, pick KPIs and weights. Choose six to eight KPIs per supplier type, write a one-line definition and data source for each, and set the 1-5 thresholds.
- Week 3, backfill one period. Score the last quarter using POs, inspection reports, invoices and returns data. This shows where your data gaps are.
- Week 4, share and review. Send each supplier its scorecard and the scoring rules, hold the first review, and agree corrective actions. Put the next review on the calendar.
For the bigger picture of how supplier performance fits with inventory, freight and fulfillment, see our ecommerce supply chain management guide.
Frequently asked questions
What is the difference between a supplier scorecard and a supplier evaluation?
A supplier evaluation usually happens once, before you place the first order, to decide whether to work with a supplier. A supplier scorecard measures an existing supplier’s actual performance on a recurring schedule. You use the evaluation to choose and the scorecard to manage.
How many KPIs should a supplier scorecard have?
Six to ten KPIs is a practical range for most ecommerce brands. Fewer than five can miss important risks, while more than ten makes data collection inconsistent and makes it harder for suppliers to know what to improve.
What is a good OTIF rate for ecommerce suppliers?
It depends on your category, lead times and how much safety stock you hold. Many brands set a target in the mid-90s percent range, but the right target is the level that keeps you from stocking out. Start from your current baseline and raise it over time.
Should I share the scorecard with my suppliers?
Yes. Sharing the scorecard, the KPI definitions and the scoring thresholds makes reviews objective and gives suppliers a clear target. Good suppliers usually welcome it, and weak ones reveal themselves by how they respond.
Can I use the same scorecard for factories, freight forwarders and 3PLs?
Use the same structure but different KPIs and weights. A factory should be weighted on quality and delivery, a freight forwarder on transit reliability and cost accuracy, and a 3PL on pick accuracy and ship-on-time rate.
How do I measure supplier quality if I don’t inspect every shipment?
Combine the signals you already have: pre-shipment inspection results when you run them, defects found at receipt by your warehouse or 3PL, and returns coded as defective or not as described. Customer reviews that mention defects are a useful supporting signal.
What tools do I need to build a supplier scorecard?
A spreadsheet in Google Sheets or Excel is enough for most ecommerce brands. Use SUMPRODUCT for the weighted score and an IFS formula for the performance band. Procurement software only becomes worthwhile when you manage many suppliers with clean system data.
What should I do if a key supplier keeps scoring poorly?
Put them on a written corrective action plan with specific dates, increase inspections, and start qualifying a backup supplier at the same time. If scores don’t improve within one or two review periods, shift volume to the backup rather than waiting for a crisis.