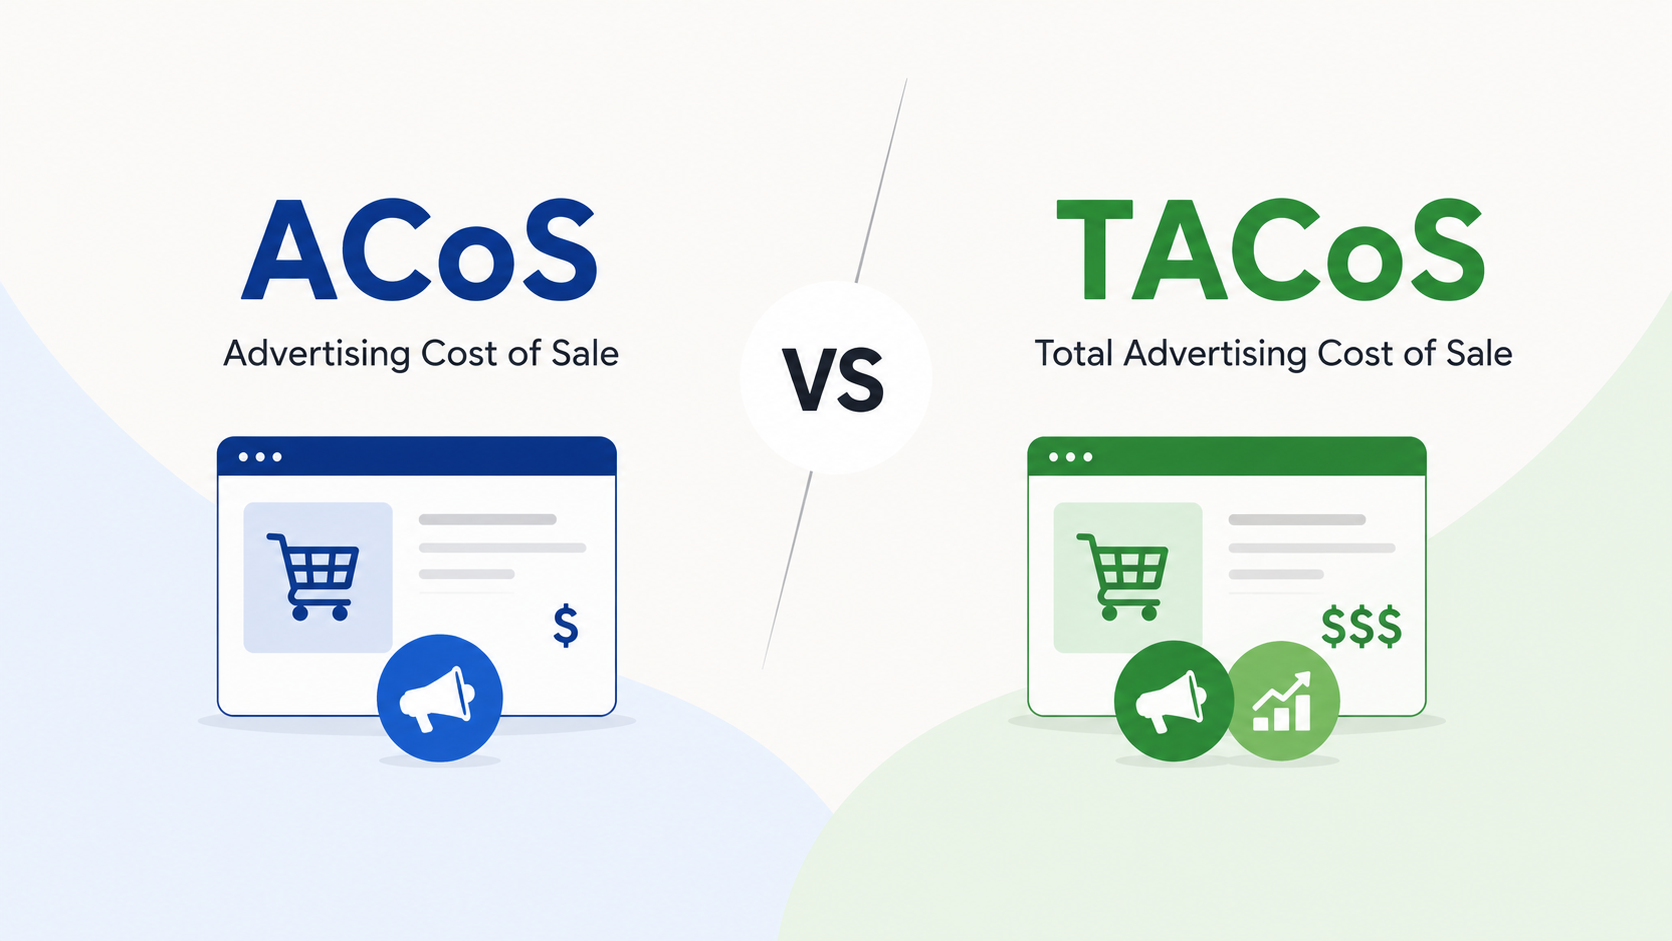
Quick answer: ACoS (Advertising Cost of Sale) measures ad spend against the sales from those ads only. TACoS (Total Advertising Cost of Sale) measures ad spend against your total sales, both ads and organic. ACoS tells you if a campaign is efficient. TACoS tells you if your whole business is healthy. The mistake most sellers make is chasing a low ACoS, which can quietly choke their organic sales. The smarter goal is a TACoS that trends down while total sales go up.
Key Takeaways
- ACoS = Ad Spend ÷ Ad Sales × 100. A campaign-level efficiency number. Lower is usually better, but not always.
- TACoS = Ad Spend ÷ Total Sales × 100. A whole-business health number. The trend matters more than the snapshot.
- ACoS has a blind spot: it only counts sales inside Amazon’s attribution window (7 days for Sponsored Products via Seller Central). It ignores the organic sales your ads helped create.
- A low ACoS is not the same as profit. Sellers who slash spend to “fix” ACoS often shrink their organic rank and total revenue.
- Use both: ACoS weekly for keyword and bid cleanup, TACoS monthly for growth and budget calls.
Here’s something we see almost every week at AcquireX.
A seller shows up proud of their 18% ACoS. The dashboard looks clean. But profit is flat and organic rank is slipping. So they cut ad spend to push ACoS even lower. Three weeks later, sales fall off a cliff.
The problem was never the ads. It was the metric they trusted.
ACoS shows one slice. TACoS shows the whole pie. If you only watch one number, you will make confident decisions that slowly shrink your brand. Let’s fix that.
What Is ACoS on Amazon?
ACoS stands for Advertising Cost of Sale.
It answers one question: for every dollar I earn from ads, how much did I spend to get it?
The formula:
ACoS = (Ad Spend ÷ Ad Sales) × 100
Quick example:
- You spend $100 on ads
- Those ads make $500 in sales
- ACoS = ($100 ÷ $500) × 100 = 20%
So 20 cents of every ad-driven dollar went back into advertising.
You can see ACoS directly inside Amazon Seller Central, in Campaign Manager, at the campaign, ad group, keyword, and placement level. Because it is so easy to find, new sellers fixate on it.
Here is its hidden flaw. ACoS only counts sales that Amazon credits to your ad inside the attribution window. For Sponsored Products run through a Seller Central account, that window is 7 days after a click. (It is 14 days for Vendor Central, and for Sponsored Brands, Sponsored Display, and DSP.) Anything outside that window, and any organic sale your ad helped trigger, gets zero credit. That gap is the whole reason TACoS exists.
What Is TACoS on Amazon?
TACoS stands for Total Advertising Cost of Sale.
It answers a bigger question: how much is my ad spend compared to everything I sell, including the organic sales I didn’t pay for?
The formula:
TACoS = (Ad Spend ÷ Total Sales) × 100
Quick example:
- You spend $100 on ads
- Ads make $500
- Organic (free) sales bring in another $1,500
- Total sales = $2,000
- TACoS = ($100 ÷ $2,000) × 100 = 5%
Same ad spend. But TACoS shows only 5% of your total business runs on ads. That is a healthy, organically strong brand.
One catch: TACoS is not shown in Seller Central. You have to calculate it yourself using your advertising reports plus your total sales from business reports, or use a tool that does it automatically.
Think of TACoS as your reinvestment rate. It shows how much of your revenue you feed back into ads to keep the engine running.
ACoS vs TACoS: The Difference in One Table
| ACoS | TACoS | |
|---|---|---|
| Measures | Ad spend vs. ad sales only | Ad spend vs. total sales (ads + organic) |
| Question it answers | Is this campaign efficient? | Is my whole business healthy? |
| Where to find it | Built into Seller Central | Calculate it yourself |
| Best for | Daily keyword and bid tweaks | Long-term growth and profit |
| A good number | Below your break-even margin | Trending down while sales rise |
| Blind spot | Ignores organic sales and halo effect | Too broad for keyword-level fixes |
| Lean on it when | New launches, cutting ad waste | Scaling, multiple SKUs, brand building |
The simplest way to remember it:
- ACoS tells you how well your ads convert.
- TACoS tells you how well your ads grow your brand.
You need both. They are not rivals. They are two gauges on the same dashboard.
Why Most Sellers Get This Wrong: The Halo Effect
Here is the trap, step by step:
- Seller sees a “high” ACoS and panics.
- They slash ad spend to make the number look better.
- ACoS drops. Dashboard looks clean.
- But fewer ads means less visibility, fewer clicks, and a weaker keyword rank.
- Organic sales fade, because the ads were quietly feeding them.
- Total revenue and profit both fall.
The seller “won” the ACoS game and lost the business.
This happens because of the halo effect. When your ads run, they push your product up the rankings and earn you free organic sales later. But remember the attribution window: ACoS only counts sales inside that 7-day click window for Sponsored Products, and only the ad-clicked sale itself. It gives your ads zero credit for the organic lift they created. TACoS catches that lift. ACoS never will.
Operator rule of thumb: A rising ACoS is not always bad. If your TACoS is falling while total sales climb, your ads are doing their job. They are buying you organic momentum.
What Is a Good ACoS and TACoS?
There is no single magic number. It depends on your margin, your category, and how old your product is. But here are real benchmarks to anchor against.
ACoS benchmarks
- The rough industry average ACoS sits around 30%. A “good” ACoS depends entirely on your product’s profit margin and campaign goals, with many sellers targeting 15% to 25% for established, profitable products.
- Your real target is your break-even ACoS, which equals your profit margin (see below).
TACoS benchmarks by product stage
| Product stage | Healthy TACoS range |
|---|---|
| New launch (building visibility) | 15% to 25% |
| Growing product | 10% to 15% |
| Mature, strong organic rank | 5% to 10% |
A good Amazon TACoS runs roughly 5% to 10% for mature products and 15% to 25% for new launches, with real variation by category and competition. A TACoS over 20% on an established product is a flag: you are leaning too hard on paid ads and your organic engine needs work.
And yes, TACoS can be too low. A TACoS under 3% can mean you are under-investing in visibility and leaving growth on the table, especially in a competitive niche. The goal is not the lowest possible number. The goal is a number that funds growth while protecting profit.
How to Calculate Your Break-Even ACoS
Before you judge any ACoS as “good” or “bad,” you need your break-even point. It is simple:
Break-Even ACoS = Profit Margin (before ad spend)
Worked example:
- You sell a product for $50
- Your costs (product, shipping, Amazon fees) are $35 per unit
- Profit per unit = $15
- Profit margin = ($15 ÷ $50) × 100 = 30%
- Your break-even ACoS is 30%
So any ACoS under 30% on that product still makes money on the sale. Above 30%, you are paying to acquire the sale at a loss (which can still be the right call during a launch). This is the number every ACoS target should be anchored to, not some generic benchmark.
The PACE Framework: How to Use Both Metrics Together
We run client accounts on a simple monthly loop we call PACE. It stops you from over-reacting to one number.
P. Pin your break-even. Know your profit margin. That is your break-even ACoS. Any campaign under it makes money on the sale.
A. Audit ACoS at the keyword level. Once a week, look at individual campaigns and keywords. Cut waste. Pause keywords that spend with no sales. Add negative keywords. This is where ACoS earns its keep.
C. Check TACoS at the account level. Once a month, zoom out. Is TACoS flat or falling while total sales grow? Good. Is TACoS climbing while sales stay flat? Your organic engine is weak and you are over-relying on ads.
E. Engineer the gap. Close the space between the two. Stronger listings, better images, and long-tail keywords lift organic sales. That pulls TACoS down without you cutting a single ad. The ads keep working; the free sales grow underneath them.
Run PACE every month and you stop guessing.
Match Your Metric to Your Product: A Quick Segmentation
Not every product deserves the same treatment. A fast way to decide which metric leads:
- Cash cows (high volume, profitable, mature): Lead with ACoS. Trim waste, protect margin. Target TACoS 5% to 10%.
- Stars (new or high-potential launches): Lead with TACoS. Accept a higher ACoS for 30 to 90 days to win rank and reviews. TACoS 15% to 25% is fine here.
- Dogs (low sales, low margin): Pause ads, bundle them, or cut them. Don’t burn budget defending a loser.
5 Ways to Lower TACoS Without Cutting Ads
Cutting ad spend is the lazy fix, and it usually backfires. Do these instead:
- Fix your product listings first. Better titles, bullets, and A+ content convert more of the traffic you already pay for. Higher conversion lifts organic rank, which grows free sales.
- Target long-tail keywords. They are cheaper, less competitive, and pull buyers who already know what they want. Higher conversion, lower waste.
- Add negative keywords. Stop paying for clicks that never convert. This trims ACoS and helps the TACoS math at the same time.
- Raise your average order value. Bundles, multi-packs, and “frequently bought together” lift revenue per order so each ad dollar stretches further.
- Build organic rank on purpose. Ads that win the top spots train Amazon’s algorithm to rank you organically. Over time, organic carries more of the load and TACoS drops.
Notice the pattern: every fix grows the bottom of the funnel (organic) instead of starving the top (ads).
A Real Before-and-After
A home goods seller came to us with a “great” 19% ACoS and flat sales. Classic over-optimization.
- Before: 19% ACoS, 4% TACoS, sales flat for two quarters. They had cut spend so hard they stopped showing up.
- What we did: Rebuilt the top listings, expanded into long-tail keywords, and raised spend on three hero products to retake page-one rank.
- After 90 days: ACoS rose to 26% (which looked “worse”), but total sales climbed and TACoS dropped to a healthier reinvestment level as organic sales grew underneath the ads.
The ugly-looking ACoS was the right move. The TACoS trend told the real story.
The What, Why, and How Recap
What is the difference? ACoS = ad spend vs. ad sales. TACoS = ad spend vs. all sales. ACoS is a zoom lens. TACoS is the wide shot.
Why does it matter? Because chasing a low ACoS alone can shrink your organic sales and profit while the dashboard looks great. ACoS only counts sales inside the attribution window. TACoS catches the organic lift ACoS hides.
How do you act on it? Use ACoS weekly for campaign tweaks. Use TACoS monthly for business health. Anchor every ACoS target to your break-even. Run the PACE loop. Lower TACoS by growing organic, not by cutting ads.
Frequently Asked Questions
What is the difference between ACoS and TACoS on Amazon?
ACoS measures ad spend against ad-attributed sales only, showing how efficient a campaign is. TACoS measures ad spend against total sales (organic plus ads), showing how healthy the whole business is. ACoS is tactical and lives in Seller Central. TACoS is strategic and you calculate it yourself. Strong sellers track both.
What is a good TACoS percentage?
For mature products with strong organic rank, 5% to 10% is healthy. New launches often sit at 15% to 25% because they are spending hard to build visibility. The trend matters more than the exact number. Falling TACoS with rising sales is the goal.
Why is my ACoS low but my profit is still bad?
A low ACoS usually means you cut spend too far. Less spend means less visibility, weaker rank, and fewer organic sales feeding off your ads. The ACoS number looks clean, but total revenue and profit drop. Check your TACoS and total sales, not just ACoS.
Can TACoS be too low?
Yes. A TACoS below about 3% can signal you are under-investing in ads. That often shows up as stalled organic rank and missed growth, especially in competitive categories. Growing brands frequently run a higher TACoS on purpose to take market share.
How do I calculate break-even ACoS?
Break-even ACoS equals your profit margin before ad spend. If your product sells for $50 and your profit before ads is $15, your margin is 30%, so your break-even ACoS is 30%. Any ACoS under 30% is profitable on that sale.
Why doesn’t ACoS count my organic sales?
Because ACoS only credits sales inside Amazon’s attribution window (7 days after a click for Sponsored Products via Seller Central, 14 days for Vendor Central and other ad types). Organic sales your ads helped create fall outside that credit. TACoS is the metric that captures them.
How often should I check each metric?
Check ACoS weekly at the keyword and campaign level to cut waste. Check TACoS monthly at the account level to see if your brand is getting stronger or more ad-dependent.
Stop Guessing. Build a System.
Most brands don’t have an ACoS or TACoS problem. They have a no one is watching both problem. The founder is busy. The freelancer only touches campaigns. Nobody owns the full picture.
That is exactly what a dedicated team fixes.
At AcquireX, our marketplace and performance marketing teams run accounts on loops like PACE every single week. We tune ACoS at the keyword level and protect TACoS at the account level, so your ads grow your brand instead of just spending your budget.
You focus on the product. We own the execution.
Want a free look at where your TACoS is leaking profit? Talk to our team and we’ll audit your account.