Summary: Marketing efficiency ratio (MER) is total net revenue divided by total marketing spend for the same period. It shows how much revenue your whole marketing program produces per dollar, independent of ad-platform attribution. A useful MER target comes from contribution margin: break-even MER equals 1 divided by contribution margin.
Ad platforms have never agreed on who deserves credit for a sale. Meta, Google, TikTok, and Amazon each report their own ROAS, and when you add those numbers up they often claim more revenue than your store actually made. Marketing efficiency ratio cuts through that by asking a simpler question: for every dollar we spent on marketing, how many dollars of revenue did the business bring in?
This guide goes beyond the basic formula. You will learn exactly what to include in revenue and spend, how to turn your margins into a break-even and target MER, how to use new-customer MER and marginal MER to scale without burning cash, and how to build a weekly MER review your team can run. If you want the bigger picture on channels and creative first, read our complete guide to ecommerce performance marketing.
What is marketing efficiency ratio (MER)?
Marketing efficiency ratio is a blended metric that compares all the revenue your business generated in a period with everything you spent on marketing in that same period. It is sometimes called blended ROAS or ecommerce efficiency ratio.
The formula is:
MER = total net revenue ÷ total marketing spend
If your store earned $200,000 in net revenue last month and spent $50,000 on marketing, your MER is 4.0x. That means every marketing dollar was associated with $4 of revenue. Flip the ratio and you get marketing spend as a percentage of revenue: $50,000 ÷ $200,000 = 25%. In other words, 1 ÷ MER is marketing’s share of every revenue dollar.
MER does not try to decide which ad caused which sale. That is its strength. It is a top-down business metric, not a campaign-optimization metric, and it works the same way no matter how many channels you run or how broken cookie-based attribution becomes.
Why does MER matter more as attribution gets harder?
Platform-reported ROAS relies on each platform tracking clicks and views back to purchases. Privacy changes, ad blockers, cross-device journeys, and modeled conversions all reduce how reliable that tracking is. Each platform also uses its own attribution window and tends to credit itself for sales that other channels or organic demand influenced.
MER sidesteps those problems because both inputs come from your own books: revenue from your store or finance system, and spend from your invoices. Three reasons it has become a core scoreboard for ecommerce brands:
- It cannot double count. Revenue is counted once, no matter how many platforms touched the order.
- It captures halo effects. Upper-funnel video that lifts branded search, Amazon sales, or direct traffic shows up in MER even when no platform gets click credit.
- It connects to profit. Because it uses total revenue and total spend, MER maps directly onto your P&L and contribution margin.
MER is not perfect, and later sections cover where it misleads. But a brand that tracks only platform ROAS is managing the business on numbers no finance team would accept.
What should you include in revenue and marketing spend?
The division is easy. The inputs are where MER calculations go wrong. Two teams can look at the same store and report very different MERs simply because they defined revenue and spend differently. Decide your definitions once, write them down, and keep them stable.
| Input | Include | Exclude or treat separately | Why it matters |
|---|---|---|---|
| Revenue | Net product sales after discounts, refunds and cancellations from your store (e.g. Shopify) for the period | Sales tax and VAT; gift card sales until redeemed; wholesale or B2B invoices unless you market to them | Gross revenue inflates MER, especially with high returns or heavy promotions |
| Shipping income | Either include or exclude, but do it the same way every period | Switching treatment month to month | Inconsistent shipping treatment creates fake trend changes |
| Paid media | All ad spend: Meta, Google, TikTok, Pinterest, Microsoft, Amazon Ads, programmatic | Nothing; count every platform | Leaving out a channel overstates efficiency |
| Partner costs | Influencer fees, affiliate commissions, UGC creator fees, sponsorships | Product seeding at cost can go to COGS if you prefer, but be consistent | These are real acquisition costs even without an ads dashboard |
| Production and people | Agency retainers, freelance media buyers, creative production, a dedicated growth team | In-house salaries, unless you want a fully loaded MER | Fully loaded MER shows the true cost of your growth engine |
| Tools | Email/SMS platform, attribution and analytics tools, landing page builders | General software like accounting or ERP | Small individually, meaningful in total |
Many teams track two versions side by side: media MER (revenue ÷ paid media only) for weekly budget calls, and fully loaded MER (revenue ÷ all marketing costs) for monthly profitability reviews. Both are valid. Mixing them is not.
If you sell on several channels, also decide whether Amazon, Walmart, or retail revenue belongs in the numerator. A clean approach is a separate MER for each storefront, using the spend that targets it, plus a total-business MER. For Amazon specifically, TACoS already plays a similar blended role inside the marketplace.
How do you calculate MER step by step? A worked example
Here is a complete example for a hypothetical DTC brand. The numbers are illustrative, but the method is exactly what you would use on your own store.
- Pick the period. October, a full calendar month.
- Pull net revenue. $300,000 after discounts and refunds, excluding sales tax.
- Add up paid media. Meta $45,000 + Google $25,000 + TikTok $5,000 = $75,000.
- Add other marketing costs. Agency and creative $10,000 + influencers and affiliates $8,000 + marketing tools $2,000 = $20,000.
- Divide.
| Metric | Calculation | Result |
|---|---|---|
| Media MER | $300,000 ÷ $75,000 | 4.00x |
| Fully loaded MER | $300,000 ÷ $95,000 | 3.16x |
| Marketing as % of revenue | $95,000 ÷ $300,000 | 31.7% |
| Contribution margin before marketing | 45% of $300,000 | $135,000 |
| Contribution after marketing | $135,000 − $95,000 | $40,000 (13.3% of revenue) |
Notice how the same month looks very different depending on the spend definition: 4.00x versus 3.16x. Neither is wrong. What matters is that you compare like with like and know which number you are setting targets on.
How do you set a break-even and target MER?
An MER of 3x is great for one brand and a loss-maker for another. The number only means something when you compare it with your margins. The key input is contribution margin before marketing: revenue minus product cost (including freight and duties), shipping and fulfillment, payment fees, platform fees, and returns, divided by revenue. Our guide to calculating contribution margin for ecommerce walks through each line.
Then use two formulas:
- Break-even MER = 1 ÷ contribution margin. At this point, marketing consumes all the contribution and the period earns nothing toward fixed costs.
- Target MER = 1 ÷ (contribution margin − desired contribution after marketing). This reserves a share of revenue to cover overhead and profit before marketing gets the rest.
In the example above, the contribution margin is 45%. Break-even MER is 1 ÷ 0.45 = 2.22x. If the brand wants to keep 10% of revenue after marketing, target MER is 1 ÷ 0.35 = 2.86x. Its fully loaded MER of 3.16x clears both.
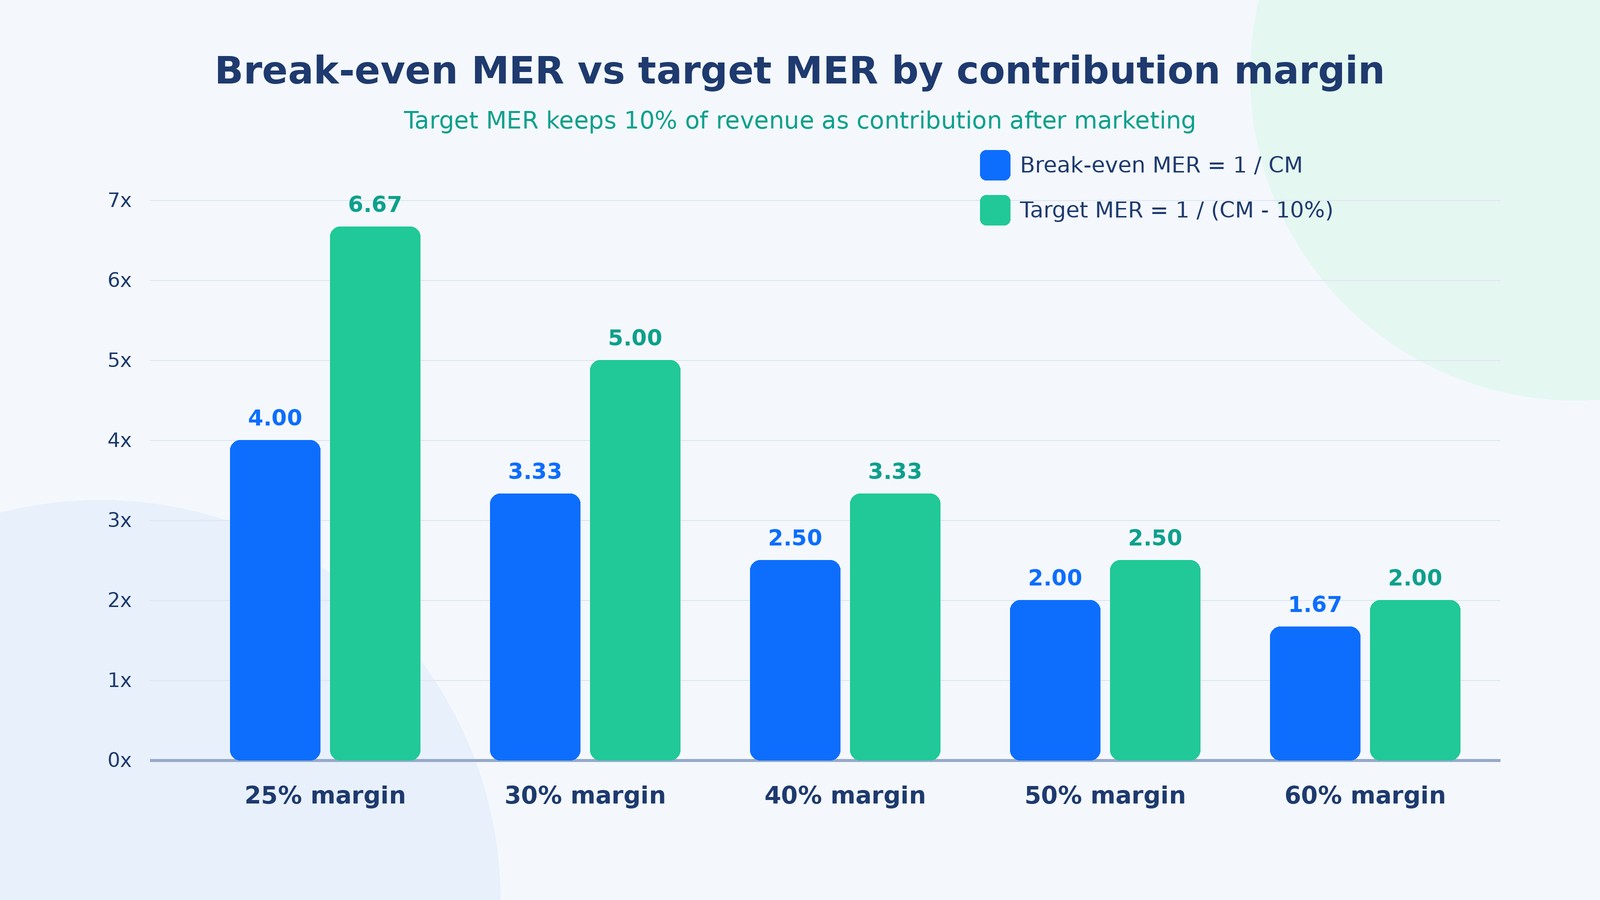
| Contribution margin | Break-even MER | Target MER (keep 10%) | Target MER (keep 15%) | Max marketing % of revenue at break-even |
|---|---|---|---|---|
| 25% | 4.00x | 6.67x | 10.00x | 25% |
| 30% | 3.33x | 5.00x | 6.67x | 30% |
| 40% | 2.50x | 3.33x | 4.00x | 40% |
| 50% | 2.00x | 2.50x | 2.86x | 50% |
| 60% | 1.67x | 2.00x | 2.22x | 60% |
The table makes one point very clear: thin-margin brands need dramatically higher MER to earn the same profit. Improving contribution margin by a few points, through better sourcing, shipping rates, or AOV, can do more for your MER target than any campaign tweak.
You can also use your target to build a budget. Divide your revenue goal by your target MER to get the maximum marketing spend: a $400,000 revenue goal at a 2.86x target MER allows about $140,000 of marketing spend. Treat that as a ceiling, not a promise, because efficiency usually falls as spend rises.
How is MER different from ROAS, aMER, CAC, and TACoS?
MER works best as part of a small set of metrics, each answering a different question. Here is how they compare.
| Metric | Formula | Question it answers | Best used for | Main blind spot |
|---|---|---|---|---|
| MER | Total net revenue ÷ total marketing spend | Is all marketing, together, paying off? | Business scoreboard, budget setting | Includes repeat and organic revenue, so it can hide weak acquisition |
| aMER (new-customer MER) | New-customer revenue ÷ total marketing spend | Are we buying new customers efficiently? | Growth health, scaling decisions | Ignores the lifetime value those customers bring later |
| Platform ROAS | Platform-attributed revenue ÷ platform spend | Which campaigns and creatives perform best inside this channel? | In-channel optimization | Over-credits itself; not additive across platforms |
| New-customer CAC | Marketing spend ÷ new customers acquired | What does one new customer cost? | Comparing with LTV and payback | Needs clean new vs. returning tagging |
| TACoS | Amazon ad spend ÷ total Amazon sales | How dependent are Amazon sales on ads? | Marketplace efficiency | Amazon only |
| Marginal MER | Change in revenue ÷ change in spend | Did the last dollar we added pay for itself? | Scaling up or cutting budget | Noisy over short periods; needs stable comparisons |
A simple rule of thumb: use platform ROAS to optimize campaigns, use MER and aMER to run the business, and use incrementality tests to settle arguments between them. When MER and platform ROAS disagree, an incrementality test such as a geo holdout tells you which channel is really driving sales.
Why should you track new-customer MER (aMER)?
Blended MER has a flattering bias. A brand with a loyal customer base can show a healthy MER even while paid acquisition is failing, because repeat buyers and email revenue fill the numerator. That looks fine until the base stops growing and revenue flattens.
Back to the example: of the $300,000 in October revenue, $120,000 came from first-time customers and $180,000 from returning customers. aMER is $120,000 ÷ $95,000 = 1.26x. That is far below the 3.16x blended MER, and it is the number that tells you how hard your marketing is working to grow the customer file.
A low aMER is not automatically a problem. If first orders are break-even or slightly negative but customers come back reliably, you can afford to pay more to acquire them. That is where lifetime value comes in. Pair aMER with new-customer CAC and the payback period from our guide to the LTV to CAC ratio for ecommerce, and you can set acquisition targets that reflect what customers are actually worth.
How do you use marginal MER to scale ad spend?
The most expensive MER mistake is reading a healthy blended number as permission to keep scaling. Blended MER is an average. Scaling decisions depend on the next dollar, not the average dollar.
Marginal MER compares the change in revenue with the change in spend between two comparable periods:
Marginal MER = (revenue now − revenue before) ÷ (spend now − spend before)
Suppose our example brand raises total marketing spend from $95,000 to $115,000 in November, a $20,000 increase, and revenue rises from $300,000 to $340,000, a $40,000 increase. Blended MER is now $340,000 ÷ $115,000 = 2.96x, still comfortably above the 2.86x target. It looks like a win.
But marginal MER is $40,000 ÷ $20,000 = 2.0x, which is below the 2.22x break-even. Check the contribution: 45% of $340,000 is $153,000, minus $115,000 of marketing leaves $38,000, which is $2,000 less than October’s $40,000. The brand grew revenue and lost profit at the same time, and blended MER never flagged it.
Practical ways to use marginal MER:
- Scale in steps. Increase spend by a set amount, hold for one to two weeks, then measure the change before the next step.
- Control for seasonality. Compare against the same period last year or a matched baseline, not just the previous week, so a holiday lift is not mistaken for ad efficiency.
- Use it with new-customer data. If marginal MER is slightly below break-even but marginal new customers are strong and LTV is high, the spend may still be worth it.
- Use it when cutting too. If you cut $10,000 and revenue barely moves, that spend was not doing much.
When can MER mislead you?
MER is a powerful scoreboard, but every blended number has blind spots. Watch for these:
- Timing mismatch. Upper-funnel campaigns, influencer content, and launches often drive sales weeks later. A short window can make brand-building look inefficient. Review rolling 28-day and quarterly MER as well as weekly.
- Promotions and price changes. A sitewide sale can lift MER while destroying margin. Always read MER next to contribution margin, not on its own.
- Organic and repeat revenue. SEO, email, and returning customers inflate MER. That is why aMER exists.
- Stockouts. Running ads into out-of-stock products drags MER down for reasons media buyers cannot fix. Flag inventory events in your reporting.
- Channel mix. Revenue from wholesale or marketplaces you do not advertise for can flatter store MER. Separate them or note them.
- No channel-level guidance. MER tells you whether marketing as a whole works, not which campaign to cut. That is the job of platform data, post-purchase surveys, and incrementality testing.
MER is the thermometer, not the diagnosis. It tells you something has changed; the other metrics tell you why.
How can you improve your marketing efficiency ratio?
There are only two levers: grow revenue faster than spend, or cut spend that is not producing revenue. In practice, these are the moves that tend to matter most.
Improve conversion and order value
Every improvement in site conversion rate or average order value raises revenue for the same traffic, which lifts MER directly. Focus on product page clarity, faster pages, bundles, and post-purchase offers before buying more traffic.
Cut spend that is not incremental
Branded search, retargeting, and some affiliate and coupon-site placements often claim credit for sales that would have happened anyway. Test reducing them and watch whether total revenue moves. If it does not, reallocate that money to prospecting.
Keep fresh creative in the system
Creative fatigue raises acquisition costs. A steady pipeline of new concepts, hooks, and formats, tested in a structured way, is one of the most reliable ways to keep efficiency up at higher spend. Automated campaign types such as Meta Advantage+ and Performance Max rely heavily on creative supply.
Grow retention revenue
Email, SMS, subscriptions, and loyalty programs add revenue at low marginal cost. Higher repeat revenue lifts blended MER and makes more aggressive acquisition affordable.
Raise contribution margin
Margin does not change MER itself, but it lowers your break-even and target MER. Better landed costs, smarter shipping thresholds, and fewer returns all give your marketing more room to work.
What does a weekly MER review look like?
MER is most useful when it becomes a routine rather than a number someone checks after a bad month. A simple weekly review, around 30 minutes, keeps marketing and finance aligned.
- Update the scoreboard. Net revenue, total spend, media MER, fully loaded MER (monthly), aMER, new customers, and new-customer CAC for the last 7 and 28 days.
- Compare with targets. Is MER above target, between break-even and target, or below break-even?
- Check marginal MER. If spend changed, did the extra spend pay for itself?
- Annotate context. Promotions, launches, stockouts, price changes, tracking issues.
- Decide budget moves. Use pre-agreed rules, such as scaling 15–20% when MER is above target for two weeks and pulling back when it falls below break-even.
- Assign channel actions. Use platform ROAS and creative data to decide where to add or cut.
| MER zone | What it means | Typical action |
|---|---|---|
| Above target MER | Marketing is efficient and leaving room for profit | Scale spend in steps; watch marginal MER and aMER |
| Between break-even and target | Profitable, but below your goal | Hold spend; fix creative, conversion rate, or non-incremental spend |
| Below break-even MER | Marketing is costing more contribution than it creates | Cut the weakest spend; check tracking, stock, and offers; only stay here deliberately for LTV-justified acquisition |
Who should own MER: in-house, an agency, or a dedicated team?
MER sits between marketing and finance, which is why it often ends up owned by nobody. Media buyers are judged on platform ROAS, finance looks at the P&L monthly, and the weekly link between them is missing.
Whoever runs your paid growth should be accountable to MER and new-customer CAC targets, not just in-platform metrics. That means they need access to store revenue, your margin model, and a clear set of budget rules. Agencies can do this, but incentives tied to spend or platform ROAS can work against it. A dedicated team embedded in your reporting rhythm tends to align more naturally with business-level targets.
How AcquireX helps brands manage to MER, not just ROAS
AcquireX’s performance marketing and growth services give ecommerce brands a dedicated offshore growth team that manages paid media against the numbers your P&L cares about. That includes:
- Target setting: building your contribution margin model and turning it into break-even MER, target MER, and new-customer CAC guardrails.
- Media buying: running Meta, Google, TikTok, and Amazon Ads with budget decisions tied to MER and marginal MER.
- Creative testing: a steady pipeline of new concepts and iterations to keep acquisition efficient as you scale.
- Measurement: a weekly MER dashboard, server-side tracking checks, post-purchase survey analysis, and incrementality test design.
If your platform dashboards say you are winning but your bank balance disagrees, MER is usually where the gap shows up first. Book a call with AcquireX and we will review your current MER, margins, and channel mix, and outline what a dedicated growth team would change first.
Key takeaways
- MER = total net revenue ÷ total marketing spend for the same period. 1 ÷ MER is marketing’s share of revenue.
- Define revenue and spend once, in writing. Track media MER weekly and fully loaded MER monthly.
- Break-even MER = 1 ÷ contribution margin. Target MER = 1 ÷ (contribution margin − desired contribution after marketing).
- Pair MER with aMER and new-customer CAC so repeat revenue does not hide weak acquisition.
- Use marginal MER for scaling: a healthy blended MER can hide extra spend that loses money.
- Use platform ROAS to optimize campaigns and incrementality tests to settle attribution disputes.
Frequently asked questions
What is a good marketing efficiency ratio for ecommerce?
A good MER is any MER above your break-even MER, which is 1 divided by your contribution margin before marketing. A brand with a 50% contribution margin breaks even at 2.0x, while a brand with a 25% margin needs 4.0x just to break even. There is no universal benchmark because margins differ so much between brands.
Is MER the same as blended ROAS?
Mostly, yes. Both divide total revenue by total marketing spend instead of using platform-attributed revenue. The difference is usually in the spend definition: some teams call it blended ROAS when they only count ad spend, and MER when they include agency fees, creative, influencer costs, and tools. Write down which version you use.
How do you calculate MER?
Divide total net revenue by total marketing spend for the same period. For example, $300,000 in net revenue and $95,000 in total marketing spend gives an MER of 3.16x. Use the same revenue definition, spend categories, and date range every time so the number is comparable month to month.
Should MER use gross or net revenue?
Net revenue is the safer choice for decision-making. Use revenue after discounts, refunds, and cancellations, and exclude sales tax or VAT. Gross revenue inflates MER, especially for brands with high return rates or heavy promotions. Whichever you choose, apply it consistently and match it to the margin you use for targets.
What is the difference between MER and aMER?
MER divides all revenue by all marketing spend, so it includes repeat customers and organic sales. aMER, or acquisition MER, divides only new-customer revenue by marketing spend. aMER shows whether you are actually buying new customers efficiently, which blended MER can hide when a strong returning-customer base props it up.
How often should I track MER?
Most ecommerce brands review MER weekly and set targets monthly. Weekly tracking lets you catch problems early, while a rolling 7-day or 28-day view smooths out daily noise. Always compare like-for-like periods, and annotate promotions, launches, and stockouts so a spike or dip is not misread.
Can MER replace platform ROAS?
No. MER and platform ROAS answer different questions. Use platform ROAS and CPA to optimize campaigns, ad sets, and creatives inside a channel. Use MER and new-customer CAC to judge whether total marketing is working for the business. Use incrementality tests to settle disagreements between the two.
Why did my MER drop when I increased ad spend?
Paid channels have diminishing returns: each extra dollar usually reaches less-ready buyers at a higher cost, so blended efficiency falls as spend rises. That is not automatically bad. Check marginal MER, the extra revenue divided by the extra spend. If marginal MER is above break-even and you are gaining new customers, scaling can still be profitable.