Quick answer: Incrementality testing measures the sales your marketing actually caused by comparing a group that sees your ads with a similar group that does not. The gap between them is your incremental lift. Ecommerce brands use platform conversion lift studies, geo holdouts, and owned-audience holdouts to find out which channels truly grow revenue and which ones mostly take credit for sales that would have happened anyway.
Every ad platform will tell you it works. Meta reports purchases, Google reports purchases, your email tool reports purchases, and your affiliate network reports purchases. Add them up and they often claim more revenue than your store actually made. That is not fraud; it is how attribution works. Each tool counts the sales it touched, and many of those buyers were already on their way to checkout. Incrementality testing is how you cut through that overlap and answer the only question that matters for budget decisions: if we turned this spend off tomorrow, how much revenue would actually disappear?
This guide is written for ecommerce and DTC operators, not data scientists. It covers what incrementality is, how it differs from attribution, the four test types worth knowing, how to design a test that produces a usable answer, the math for reading results, and how to turn a single test into a measurement habit. It goes deeper on the testing side than our broader ecommerce performance marketing guide, which covers channel strategy as a whole.
What is incrementality testing in ecommerce?
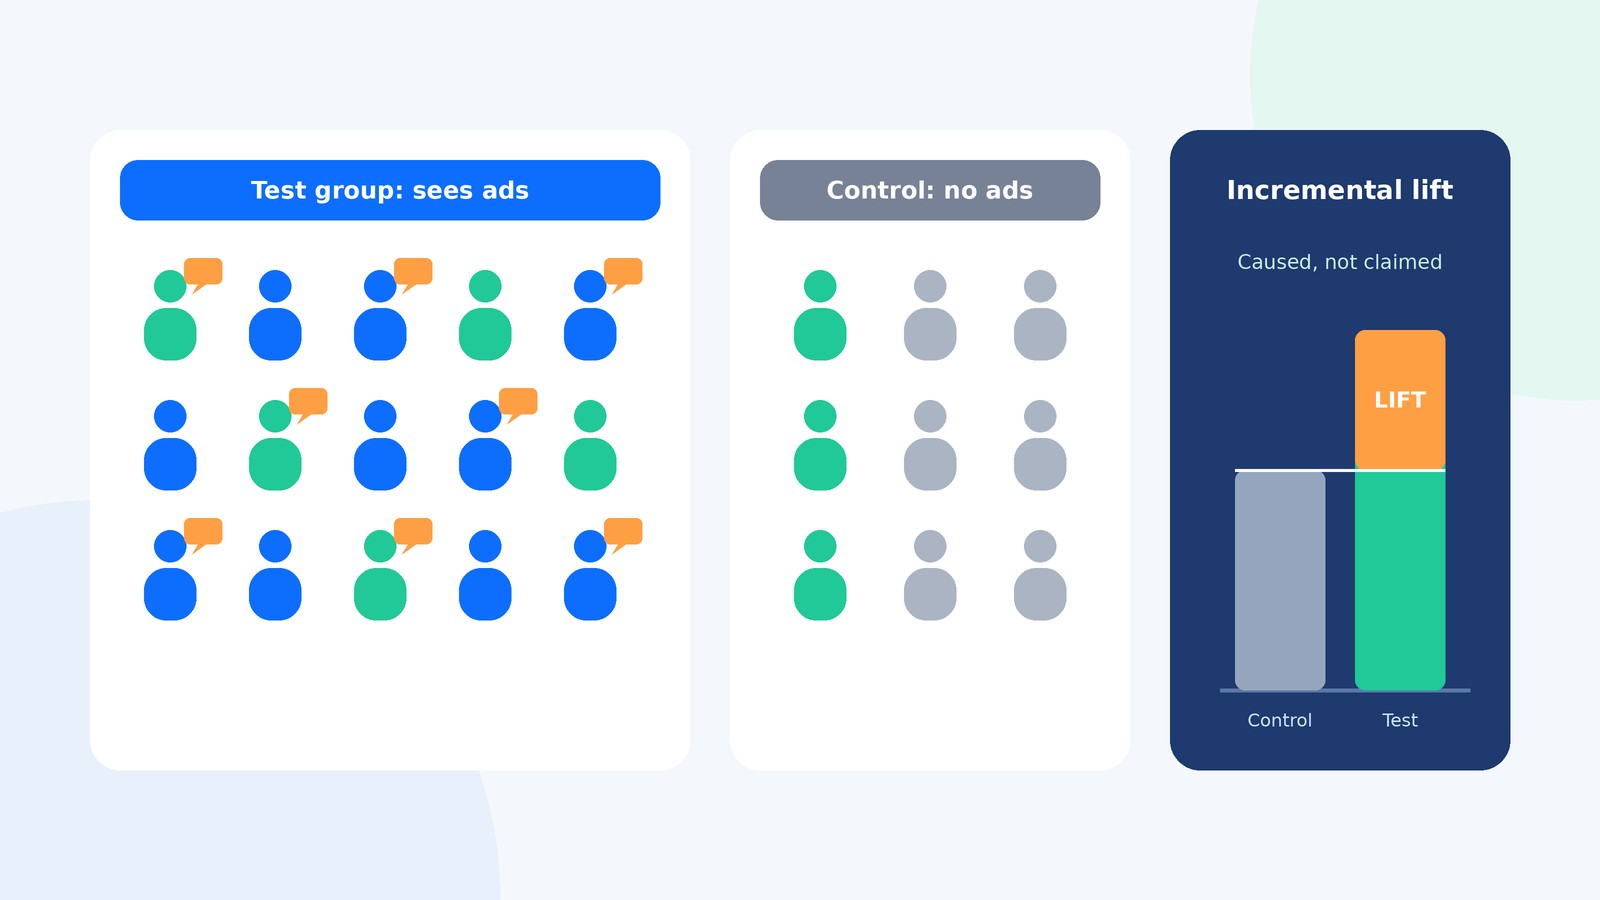
Incrementality testing is a controlled experiment that isolates the causal effect of a marketing activity. You split a population into two comparable groups. The test group (sometimes called treatment) is exposed to the campaign as normal. The control group (the holdout) is deliberately not exposed. Because the groups are otherwise alike, any difference in purchases between them can be credited to the campaign.
The split can happen at the level of individual users (the ad platform randomly withholds ads from some people), at the level of geography (you pause spend in some regions but not others), or at the level of your own customer lists (a random slice of subscribers does not get a flow). The principle is the same in each case: incrementality is measured by comparison with a counterfactual, not by counting who clicked.
The core output is incremental lift: the extra conversions or revenue in the test group beyond what the control group tells you would have happened anyway. From there you can calculate incremental ROAS (iROAS), incremental cost per acquisition (iCPA), and, most usefully for a profit-focused brand, incremental contribution margin.
How is incrementality different from attribution?
Attribution assigns credit for a sale to the touchpoints that preceded it. Incrementality asks whether the sale would have happened without those touchpoints. They answer different questions, and confusing them is the root of most wasted ad budgets.
| Question | Attribution (last click, data-driven, MTA) | Incrementality testing |
|---|---|---|
| What it measures | Which tracked touchpoints were present before a conversion | How many conversions the activity actually caused |
| Method | Rules or models applied to tracking data | Controlled experiment with a test group and a holdout |
| Handles buyers who would have purchased anyway | No; it credits them to whatever they touched | Yes; the control group shows that baseline |
| Sees offline or view-only influence | Poorly; depends on clicks and cookies | Yes, when designed at the geo or user level |
| Speed | Daily, continuous | Weeks per test |
| Best used for | Day-to-day bid, creative, and budget pacing | Validating channels and setting budget levels |
The two are complementary. Attribution is a fast, directional dashboard. Incrementality tests are the periodic reality check that tells you how much to trust it. Post-purchase surveys sit in between: they capture influence that clicks miss, but as we explain in our guide to post-purchase surveys and zero-party attribution, a survey tells you what customers remember, not what caused them to buy.
Why does platform-reported ROAS overstate results?
Platform ROAS is not wrong so much as generous. Several mechanisms push it upward:
- Existing demand gets claimed. Retargeting and branded search reach people who are already close to buying. Many would have converted without the ad, but the platform still counts the sale.
- Overlapping credit. One order can be claimed by Meta (view-through), Google (click), email (open), and an affiliate (coupon code) at the same time.
- View-through windows. Counting a purchase because someone scrolled past an ad within a day is a loose definition of influence.
- Algorithms optimize toward likely buyers. Automated campaigns are very good at finding people who were going to buy. That is efficient for the platform’s reported numbers, but it does not necessarily create new demand.
None of this means paid media does not work. It means the reported number and the caused number are different, and the size of that gap varies a lot by channel, campaign type, and audience. That is exactly why you test rather than apply a generic discount to every channel.
What are the main types of incrementality tests?
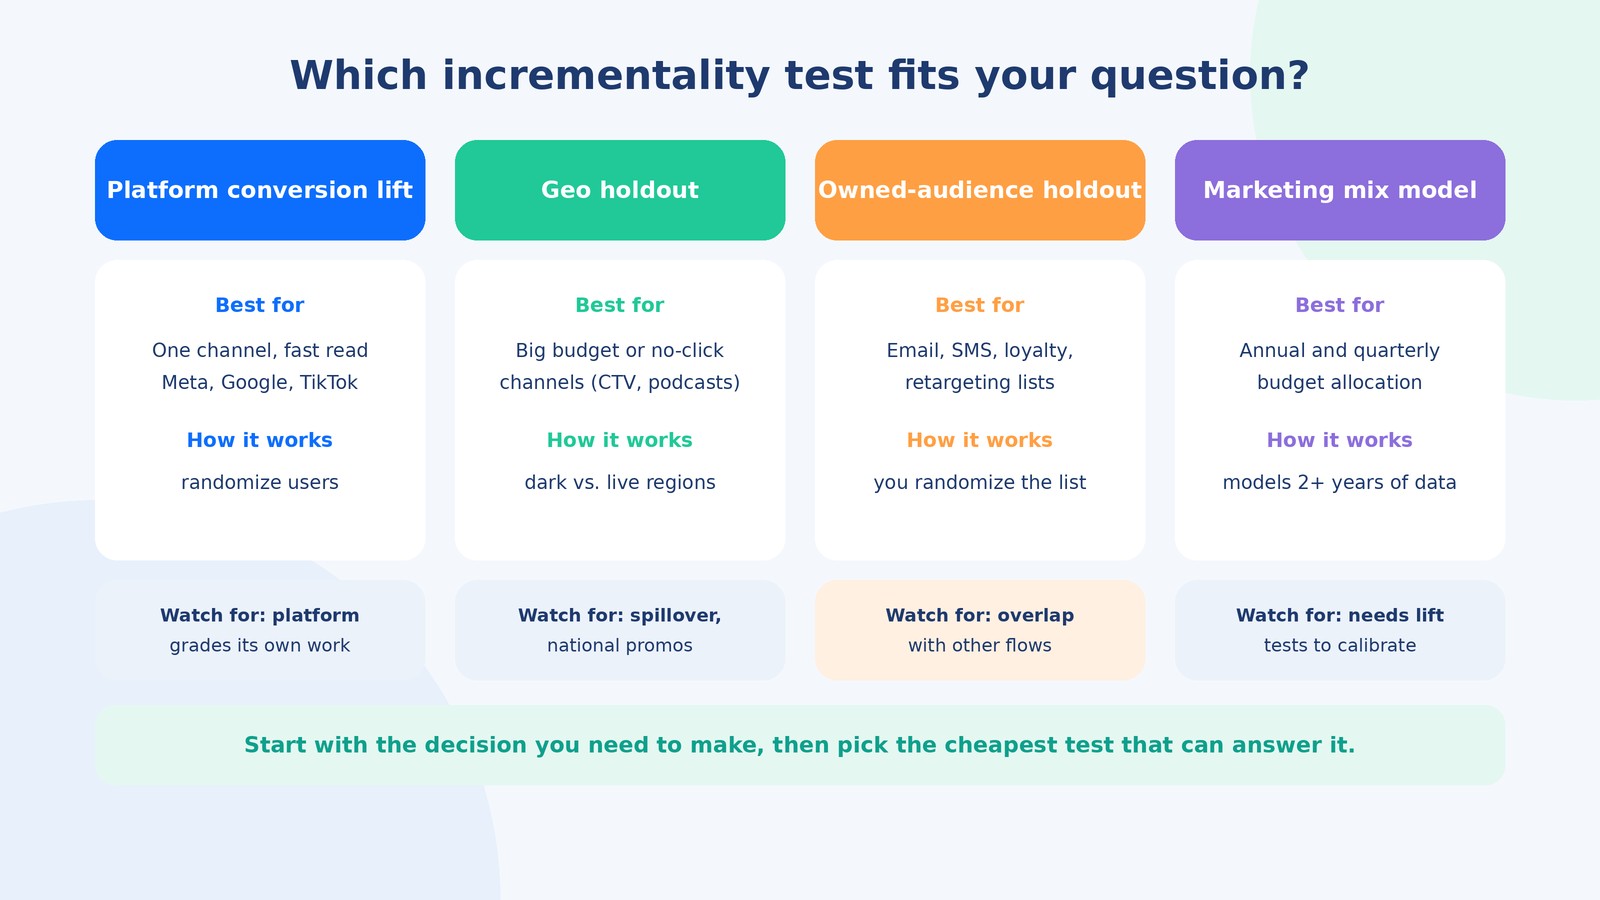
Four methods cover almost every ecommerce situation. Pick based on the decision you need to make and the data you have, not the tool you already pay for.
1. Platform conversion lift studies
Meta, Google, and TikTok all offer lift studies inside their ad tools. The platform randomly assigns eligible users to a test group that can see your ads and a control group that cannot, then reports the difference in conversions. In Google Ads, the control group is shown the next ad in the auction instead of yours. These studies are usually free if you meet the platform’s eligibility thresholds for spend and conversion volume, and they are the fastest way to get a causal read on a single channel. Google’s own help documentation, for example, sets a study length between 7 and 56 days and recommends a meaningful budget and conversion volume to reach a confident result.
The limitation is obvious once stated: the platform is grading its own homework. The methodology is sound, but you cannot audit the data, and the study cannot see effects on other channels, such as ads that drive branded searches or Amazon sales.
2. Geo holdout (matched market) tests
You divide your markets (US states, DMAs, or groups of ZIP codes) into a test set and a control set that historically behave alike, then change spend in one set and compare total store revenue across both. Because it measures your own Shopify or order data rather than platform-reported conversions, a geo test captures everything: direct traffic, branded search, marketplace sales in those regions, and even channels with no click path such as podcasts, CTV, or influencer content.
Geo tests take more work. You need enough geographic spread, a clean way to target or exclude regions, and a statistical method for building the comparison. Open-source tools help a lot: Meta’s GeoLift package and Google’s Meridian GeoX design tools both use synthetic control methods, which build a weighted “twin” of the test regions from the control regions so the comparison is fair.
3. Owned-audience holdouts
When you control the list, you control the randomization. Hold out a random 5 to 10 percent of subscribers from a welcome flow, a winback series, an SMS campaign, or a loyalty perk, and compare purchase rates over the following weeks. This is the cheapest and cleanest test most brands can run, and it frequently reveals that some flows are mostly sending messages to people who would have bought anyway. It is especially useful before you invest more in retention programs or apps.
4. Marketing mix modeling (MMM)
MMM is not an experiment; it is a statistical model that estimates each channel’s contribution from a couple of years of weekly spend and sales data. Open-source options such as Google’s Meridian and Meta’s Robyn have made it accessible to mid-sized brands. MMM is best for annual and quarterly budget allocation across the whole mix. Its weakness is that models can attribute effects to the wrong channel when spend moves together, which is why the strongest measurement programs use lift tests to calibrate the MMM rather than treating them as rivals.
| Method | Measures | Typical effort | Main risk | Use it when |
|---|---|---|---|---|
| Platform conversion lift | User-level lift inside one platform | Low; set up in the ad tool | Platform controls the data; misses cross-channel effects | You want a fast read on Meta, Google, or TikTok |
| Geo holdout | Total business lift by region | Medium to high; needs design and analysis | Spillover between regions, national promos | Big budget lines, upper-funnel or no-click channels |
| Owned-audience holdout | Lift from email, SMS, loyalty, retargeting lists | Low; a random split in your ESP | Overlap with other flows reaching the same people | You want to know if retention programs earn their cost |
| Marketing mix model | Modeled contribution of every channel | High; needs 2+ years of clean data | Correlated spend leads to misattribution | You set annual or quarterly budgets across many channels |
When should an ecommerce brand start incrementality testing?
You do not need a data science team, but you do need enough volume for the signal to rise above normal day-to-day noise. A practical rule: start testing when a single channel or campaign type is a large enough share of spend that being wrong about it would materially change your profit. For most brands that is the largest paid social or Google line, followed by retargeting and branded search, which are the most likely to be over-credited.
Owned-audience holdouts can start almost immediately because they only need a list and a random split. Geo tests make sense once you sell across many regions and spend enough that pausing a portion of it for a few weeks is a meaningful experiment. If your volume is too small for any of these to be conclusive, focus first on clean tracking (server-side events through tools like the Meta Conversion API) and on margin-based reporting, so that when you are ready to test, you can trust the inputs.
How do you design an incrementality test step by step?
Most failed tests fail in the design phase, not the analysis. Follow these steps in order.
- Write down the decision. “Should we keep spending on branded search?” or “Does Meta prospecting pay back at the current budget?” A test that cannot change a budget line is a science project.
- State a hypothesis and an expected lift. Estimate how much incremental revenue you think the channel drives. This sets the size of effect your test must be able to detect.
- Pick one primary metric and a few guardrails. The primary metric is usually incremental orders, revenue, or new customers. Guardrails might include return rate, discount usage, and branded search volume.
- Choose the method that fits the decision. Use the table above. Match the method to the question, not the other way around.
- Check statistical power before you launch. Use the platform’s feasibility estimate or the power analysis in GeoLift or a similar tool. If the test can only detect a 30 percent lift and you expect 10 percent, it will end inconclusive. Run longer, use a bigger holdout, or test a bigger budget change instead.
- Size the holdout. Bigger holdouts give clearer answers but cost more in lost sales if the channel works. If you cannot tolerate going dark, run an inverse test: keep spend flat everywhere and add budget only in the test regions.
- Freeze confounders. Avoid launching new promotions, price changes, major site releases, or other new channels during the test. Log anything you cannot avoid, such as stockouts or PR spikes.
- Pre-register the readout. Agree before launch on the metric, the analysis method, the test window, and what each outcome will trigger. Then do not stop early because the chart looks good after week one.
- Include a cooldown. Some customers see an ad and buy days later. Read results after a post-period long enough to capture that delayed response.
- Turn the result into an action and a calendar entry. Scale, hold, cut, or redesign, and schedule the next retest.
If you need help running this process alongside daily campaign management, our performance marketing and growth team designs lift tests, sets up geo and audience holdouts, and translates the results into budget changes for Shopify and marketplace brands.
How do you calculate incremental lift, iROAS, and iCPA?
The math is simple once the test is clean. The core formulas:
| Metric | Formula | What it tells you |
|---|---|---|
| Incremental conversions | Test conversions minus expected conversions without ads (from the control group, scaled to the test group’s size) | Sales the activity caused |
| Incremental lift (%) | Incremental conversions divided by expected conversions without ads | How much the activity grew results above baseline |
| Incremental ROAS (iROAS) | Incremental revenue divided by ad spend | Revenue caused per dollar spent |
| Incremental CPA (iCPA) | Ad spend divided by incremental conversions | True cost of a net-new order |
| Incrementality factor | Incremental conversions divided by platform-reported conversions | How much to discount the platform dashboard |
| Incremental contribution | Incremental revenue times contribution margin percentage, minus ad spend | Whether the activity made or lost money |
A worked example (illustrative numbers)
The figures below are a hypothetical example to show the calculation, not benchmarks.
A brand spends $40,000 on Meta prospecting over four weeks. Ads Manager reports 1,600 purchases and $128,000 in revenue, a platform ROAS of 3.2. A conversion lift study for the same period estimates 800 incremental purchases. With an average order value of $80, that is $64,000 in incremental revenue.
- iROAS = $64,000 / $40,000 = 1.6
- iCPA = $40,000 / 800 = $50
- Incrementality factor = 800 / 1,600 = 0.5, meaning roughly half of the platform-reported purchases were caused by the ads
Now apply margin. If the brand’s contribution margin after product cost, shipping, payment fees, and returns is 40 percent, the incremental contribution from the first order is $64,000 times 0.40, or $25,600, against $40,000 of spend. On first-order economics alone, this campaign loses $14,400. Whether that is acceptable depends on repeat purchase behavior, which is why the next step is to compare iCPA with customer lifetime value using a method like the one in our LTV to CAC ratio guide. If customers acquired this way reliably buy again, a $50 iCPA might be a bargain; if they rarely return, the budget should shrink or the campaign should change.
This is the main benefit of incrementality testing: it replaces a flattering 3.2 ROAS with a number you can actually plug into a profit model. For the margin side of that model, see our guide to contribution margin for ecommerce.
Which channels should you test first?
Prioritize where the gap between reported and caused results is likely to be widest, and where the budget is large enough for the answer to matter.
| Channel | Why test it | Suggested method |
|---|---|---|
| Branded search | Often captures people already searching for you; may be cheap insurance or mostly redundant | Geo holdout, or a careful time-based pause with matched controls |
| Retargeting and dynamic product ads | Reaches high-intent visitors who may buy anyway | Platform conversion lift or audience holdout |
| Meta prospecting and Advantage+ campaigns | Usually the biggest line; automation can lean toward easy converters | Platform conversion lift, confirmed with a geo test |
| Google Performance Max | Mixes brand, shopping, and remarketing inventory in one campaign | Conversion lift or geo holdout |
| Email and SMS flows | Easy to over-credit because opens and clicks are counted | Owned-audience holdout |
| CTV, podcasts, influencers | Little or no click path, so attribution misses them | Geo holdout |
For automated campaign types specifically, our comparisons of Advantage+ versus manual Meta campaigns and the Performance Max guide explain where incrementality checks fit into campaign structure.
What mistakes make incrementality tests unreliable?
- Underpowered tests. Too little volume or too short a window produces a wide confidence range that cannot separate a weak channel from a strong one. Check power first.
- Peeking and stopping early. Checking results daily and stopping when they look good dramatically increases the chance of a false positive.
- Contaminated controls. A national email blast, a sitewide sale, or an influencer post during the test lifts both groups unevenly. In geo tests, people who live in one region and shop in another blur the line.
- Poorly matched regions. Pairing markets by gut feel instead of by historical sales patterns is the most common reason geo tests produce noise. Validate that the groups tracked closely before the test.
- Measuring the wrong outcome. Orders are not profit. Include refunds, returns, discount depth, and whether buyers were new or existing customers.
- Treating one test as permanent truth. Incrementality changes with spend level, creative, season, and competition. A channel that was highly incremental at $20,000 a month may not be at $80,000.
- Ignoring halo effects. A Meta campaign might lift Amazon sales or branded search. User-level platform studies will not see that; geo tests built on total revenue can.
How do you turn incrementality results into budget decisions?
A single test is useful; a repeatable program is far more valuable. The approach that works for most growing brands looks like this:
- Build a calibration table. For each tested channel, record the incrementality factor, the test date, the spend level, and the confidence range.
- Apply factors to daily dashboards. Multiply platform-reported conversions by the channel’s factor to get an “incrementality-adjusted” ROAS your team can use day to day without running a new test.
- Set budgets on marginal returns. Raise spend in steps on channels with strong incremental contribution, and watch whether iCPA rises as you scale. Diminishing returns are normal; the question is where the next dollar stops paying back.
- Retest on a schedule. Revisit the biggest channels every quarter or two, and retest after major changes in spend, campaign structure, or creative strategy.
- Feed results into planning. If you run an MMM, use lift results to calibrate it. If you do not, the calibration table itself becomes your planning model.
The goal is not to test everything constantly. It is to make sure the numbers your team optimizes against every day are anchored to what actually grows the business.
Should you run incrementality testing in-house or with a partner?
Owned-audience holdouts and platform lift studies are well within reach of an in-house marketer with some analytical comfort. Geo testing and MMM take more statistical and data engineering work: cleaning order data by region, building matched markets, running power analysis, and interpreting results without overclaiming. Many brands split the work, keeping strategy and decisions in-house and outsourcing the test design, setup, and analysis to a team that does it routinely.
That is how AcquireX’s performance marketing growth services are typically used: a dedicated team runs paid media day to day, sets up lift and holdout tests on the biggest budget lines, and reports on incremental contribution rather than platform ROAS. If you want a second opinion on whether your current spend is truly incremental, book a call with our team and we will walk through your channel mix and suggest the first test worth running.
Frequently asked questions about incrementality testing
What is a good incrementality factor?
There is no universal good number. The factor depends on channel, audience, and spend level. Retargeting and branded search tend to show lower factors because they reach people who were already likely to buy, while prospecting to new audiences tends to be more incremental. What matters is whether the incremental contribution beats the cost of the spend.
How long should an incrementality test run?
Long enough to reach the sample size your power analysis calls for and to capture delayed purchases, usually several weeks plus a short cooldown period. Platform lift studies have their own minimum and maximum windows; Google Ads, for example, documents a range of 7 to 56 days.
Is a holdout test the same as an A/B test?
They are related but not the same. An A/B test compares two versions of something, such as two ad creatives. A holdout test compares something against nothing, so the control group gets no exposure. Incrementality testing uses holdouts because it needs a true “no ads” baseline.
Can small Shopify stores run incrementality tests?
Yes, with the right method. Owned-audience holdouts on email and SMS work at almost any size. Platform lift studies and geo tests need more conversion volume. If you are too small for those to be conclusive, a longer test window or a larger budget change can help, and so can focusing on your single biggest channel.
Do I lose sales by running a holdout?
If the channel is truly incremental, yes, the holdout group will buy a little less during the test. That cost is the price of knowing. You can reduce it with a smaller holdout, a shorter test, or an inverse design that adds spend in test regions rather than removing it in control regions.
What is the difference between iROAS and ROAS?
ROAS divides all attributed revenue by spend, including sales that would have happened anyway. iROAS divides only incremental revenue, the revenue the test proves the ads caused, by spend. iROAS is almost always lower and is the better number for budget decisions.
Can I trust lift studies run by Meta or Google?
The randomized methodology is sound, but the platform controls the data and cannot see effects outside its own system. Treat platform lift results as a strong signal, label them as platform-reported, and confirm the most important ones with a geo test measured on your own order data.
How often should I retest a channel?
Retest your largest channels every quarter or two, and any time spend, targeting, campaign type, or creative strategy changes significantly. Incrementality drifts as you scale, so an old result can mislead you if your budget has doubled since.