Your gross margin says 70%. Your bank account says you are broke. Both can be true at the same time.
That gap is the whole problem. Gross margin only takes out the cost of the product. It ignores shipping, ad spend, payment fees, returns, and the discounts you hand out. Those costs are real, and they grow every time you sell more. Contribution margin is the number that counts them. It tells you what is actually left after every cost that moves with a sale. If you only watch gross margin, you can grow revenue all year and still lose money on each order. This guide shows you the formula, a worked example, real benchmarks, and a simple system to fix a weak margin.
Quick Answer
Contribution margin is your revenue minus every cost that changes with each sale. That means product cost, shipping, payment fees, returns, discounts, and ad spend. What is left covers your fixed costs (rent, salaries, software) and then becomes profit.
Key takeaways:
- Gross margin only removes product cost. Contribution margin removes all variable costs: shipping, payment fees, returns, discounts, and ad spend.
- A product can show 70% gross margin and land at 25% contribution margin. That 45-point gap is where money quietly disappears.
- For most DTC brands in 2026, a healthy contribution margin after ads is 20% to 30%. Below 10% signals a pricing or acquisition problem.
- Track contribution margin by SKU and by channel, never as one blended number. A blended 22% can hide a DTC channel at 30% next to an Amazon channel at 8%.
- The same product can carry a different contribution margin on DTC, Amazon, and wholesale, sometimes a 15-point swing on the same item.
- Your margin before ad spend sets the ceiling on what you can pay to acquire a customer. Spend past that number and the order loses money.
- Returns alone can cost 19.3% of online sales in 2025, according to the National Retail Federation, and that cost rarely gets attributed back to the product that caused it.
What Is Contribution Margin in Ecommerce?
Contribution margin is the money left from a sale after you subtract every cost that rises and falls with volume.
Here is the plain formula:
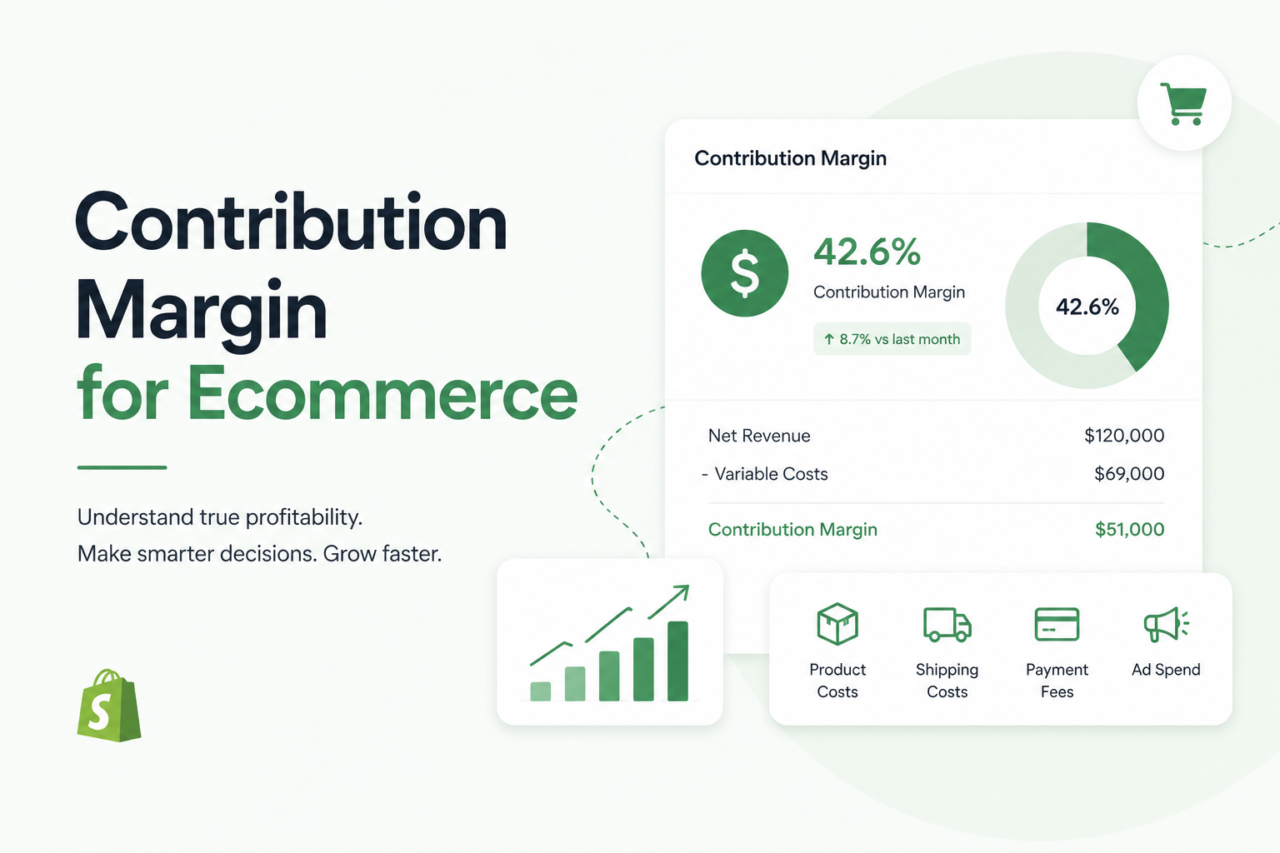
Contribution Margin = Net Revenue − COGS − Shipping − Payment Fees − Returns − Discounts − Ad Spend
Net revenue is your sale price after refunds and chargebacks. The costs you take out are called variable costs. They move with each order. Sell one more unit, you pay them again. Sell zero, they go away.
Fixed costs are different. Rent, salaries, and your software bills stay the same whether you sell 10 units or 10,000. Contribution margin is the cash that helps you cover those fixed costs. Once your total contribution margin passes your fixed costs, you make a profit.
Contribution Margin vs Gross Margin: What Is the Real Difference?
Gross margin stops at the cost of the product. Contribution margin keeps going until every variable cost is gone.
Think of it as two questions:
- Gross margin asks: is this product worth making?
- Contribution margin asks: is this product worth selling, through this channel, at this ad cost?
A brand can have a strong 60% gross margin and still bleed cash. Why? Because shipping, fees, returns, and ads can eat 30 or 40 points of margin that gross margin never shows. Most Shopify dashboards and basic profit reports do not attribute those costs at the product level, so the leak stays hidden.
Here is a simple way to picture the layers. Many operators split contribution margin into three steps:
- Layer 1: Revenue minus product cost. This is your gross margin.
- Layer 2: Layer 1 minus shipping, fulfillment, payment fees, returns, and discounts. This is your margin before ads.
- Layer 3: Layer 2 minus ad spend. This is your true contribution margin.
Layers 1 and 2 can look great while Layer 3 quietly turns negative on the campaigns losing you money. That is why you track all three.
How Do You Calculate Contribution Margin? (A Worked Example)
Let us walk one real order, step by step, so the math is clear.
Say you sell a skincare serum for $60. Here are the costs that move with each sale:
| Line item | Amount |
|---|---|
| Sale price | $60.00 |
| Product cost (COGS) | $18.00 |
| Shipping and fulfillment | $7.00 |
| Payment processing (3%) | $1.80 |
| Returns allocation | $3.00 |
| Discount (average promo) | $3.00 |
| Ad spend per order | $12.00 |
Now run the layers:
- Gross margin: $60 − $18 = $42, which is 70%. Looks amazing.
- Margin before ads: $42 − $7 − $1.80 − $3 − $3 = $27.20, which is 45.3%.
- Contribution margin: $27.20 − $12 = $15.20, which is 25.3%.
Look at the drop. The product shows 70% on paper. After the real costs of selling it, you keep 25.3%. That $15.20 is what goes toward your rent, your team, your tools, and finally your profit.
One more powerful use. Your margin before ads was $27.20. That is the most you can spend to get a customer before the order loses money. You spent $12, so you have room. If your ad cost ever climbs past $27.20, you pay to lose money. For a deeper look at this number, see our guide on cost per order in ecommerce.
Why the Same Product Has a Different Margin on Every Channel
This is the part most brands never check. The same $60 serum does not earn the same contribution margin on DTC, Amazon, and wholesale. The cost stack is different on each one.
| Layer | DTC (Shopify) | Amazon FBA | Wholesale |
|---|---|---|---|
| Sale price | $60.00 | $60.00 | $30.00 (50% of retail) |
| Product cost (COGS) | $18.00 | $18.00 | $18.00 |
| CM1 (gross margin) | $42.00 (70%) | $42.00 (70%) | $12.00 (40%) |
| Shipping and fulfillment | $7.00 | (in referral fee) | $2.00 |
| Payment processing | $1.80 | (included in referral fee) | $0.50 |
| Amazon referral fee (15%) | n/a | $9.00 | n/a |
| FBA fulfillment fee | n/a | $5.50 | n/a |
| Returns allocation | $3.00 | $2.00 | n/a |
| Trade spend / co-op marketing | n/a | n/a | $1.50 |
| CM2 (before ads) | $27.20 (45.3%) | $25.50 (42.5%) | $8.00 (26.7%) |
| Ad spend (DTC ads or Amazon PPC) | $12.00 | $6.00 | $0 |
| CM3 (true contribution margin) | $15.20 (25.3%) | $19.50 (32.5%) | $8.00 (26.7%) |
A few things jump out here. Amazon’s referral fee already includes payment processing, so that line disappears from the stack. Amazon PPC often costs less per unit than DTC ads because the marketplace brings its own shoppers. And wholesale needs no acquisition spend at all, but it starts from a much lower sale price, so the dollar amount left over is the smallest of the three even though the percentage looks fine.
The lesson: do not assume your best-converting channel is your most profitable one. Run this table for your own top SKU before you decide where to push more ad budget. Our marketplace management team builds this breakdown for clients across every active channel, not just the one with the most orders.
What This Looks Like in Practice
Here is a composite example, built from patterns we see across DTC and Amazon accounts, not one specific client.
A mid-size skincare brand was tracking 65% gross margin company-wide and felt good about it. Revenue was growing every quarter. But when the team broke contribution margin out by channel, the picture changed. DTC was running a healthy 28% CM3. Amazon, their fastest-growing channel, was sitting at 9% CM3 once referral fees, FBA costs, and rising PPC bids were counted. The blended number, 21%, looked fine on a dashboard and hid the fact that every new Amazon dollar was earning less than half what a DTC dollar earned.
The fix was not more ad spend. It was a ceiling. The brand set a hard rule: no Amazon campaign runs above a target ACoS that protects a 20% CM3 floor, and any SKU that cannot hit that floor on Amazon gets pulled from paid placement there and pushed through DTC instead. Within two quarters, blended contribution margin moved from 21% to 25%, without slowing total revenue growth.
That is the shift. Not tracking the number once a quarter, but using it weekly to decide where every ad dollar goes.
The MARGIN Method: A System to Find and Fix Your Margin
Most brands calculate contribution margin once, get scared, and never act. The MARGIN Method turns the number into a repeatable routine. Run it every month.
M: Map every variable cost. Write down each cost that moves with a sale. Product, shipping, fulfillment, payment fees, returns, discounts, and ads. Miss one and your number lies to you.
A: Attribute costs to the order. Do not use one blended average for the whole catalog. A heavy product costs more to ship. A discounted SKU keeps less. Tie each cost to the order that caused it.
R: Rank by SKU and channel. Sort your products and your channels from best margin to worst. A blended 22% can hide DTC at 30% and Amazon at 8%. The blend buries the problem.
G: Gate your ad spend. Use your margin before ads as the ceiling for what you pay to acquire a customer. Set that limit per channel. This stops you from scaling a campaign that loses money on every click.
I: Improve one leak at a time. Pick the biggest drain first. Maybe it is shipping. Maybe it is returns. Fix one, measure, then move to the next. Chasing all five at once gets you nowhere.
N: Never scale on blended numbers. Before you pour more cash into ads, check Layer 3 by channel and SKU. Scale the winners. Cut or fix the losers.
What Drains Your Margin the Most?
Five costs do most of the damage. Watch these closely.
- Ad spend (CAC). For many DTC brands, ads eat 20% to 35% of revenue. This is usually the biggest leak. Our breakdown of ACoS vs TACoS shows how to keep ad cost in check.
- Shipping and fulfillment. Free shipping is not free. You pay for it. Heavier and bigger items cost more, so map cost by SKU. If you are weighing your setup, read 3PL vs in-house vs hybrid fulfillment.
- Returns. An estimated 19.3% of online sales were returned in 2025, per the National Retail Federation. Each return brings a refund, return shipping, and sometimes a write-off. See ecommerce returns management to cut the rate.
- Marketplace and payment fees. Amazon referral fees sit at 15% for most categories and run from 8% up to 45%. Card processing adds about 2.9% plus $0.30 per order. These stack fast.
- Discounts. Every coupon trims your real sale price. On Amazon, a coupon can even raise your effective fee, because the referral fee is figured on the original price.
What Is a Good Contribution Margin for an Ecommerce Brand?
A good contribution margin after ads sits near 20% to 30% for most DTC brands in 2026. It varies a lot by category.
Rough targets to compare against:
- Beauty and supplements: higher, often 30% to 45%, thanks to low product cost and light shipping.
- Apparel and fashion: mixed, because return rates run high.
- Food and beverage: lower, often 10% to 20%, due to thin margins and heavy shipping.
- Marketplaces (Amazon, Walmart): thinner, often 15% to 25%, after referral and fulfillment fees.
Treat these as a starting point, not gospel. Pull your own numbers from your store and your settlement reports. Your real benchmark is last month’s number, and the goal is to beat it.
How Do You Improve a Weak Contribution Margin?
You raise contribution margin by lifting revenue per order or cutting a variable cost. Pick the lever with the most room.
Fast levers to test:
- Raise prices on your best SKUs. A small price bump flows almost straight to margin. See pricing strategies for ecommerce.
- Lift average order value. Bundles and add-ons spread your shipping and acquisition cost across more revenue. Try these upselling and cross-selling strategies.
- Cut your return rate. Better sizing guides, clearer photos, and honest copy reduce returns and protect margin.
- Renegotiate shipping and supplier costs. A few cents per unit, times thousands of orders, is real money.
- Tighten ad targeting. Lower your acquisition cost and Layer 3 climbs on its own.
You do not need all five. Fix the biggest leak first. That is the MARGIN Method in action.
Why This Is an Execution Problem, Not Just a Math Problem
Knowing your contribution margin is step one. Acting on it, every week, across every SKU and channel, is the hard part.
Most brands stall because no one owns the number. The founder is busy. The agency reports on ad spend, not profit. The freelance analyst leaves and the whole model breaks. So the margin leak keeps running.
This is where a dedicated team beats a stack of vendors. AcquireX builds an embedded operator team inside your business. We are not an agency that hands you a dashboard and walks away. We own the execution: the performance marketing, the marketplace management, the fulfillment, and the margin work behind them. You focus on growth. We handle the chaos.
Frequently Asked Questions
What is contribution margin in simple terms?
Contribution margin is the money left from a sale after you subtract every cost that changes with that sale. That includes product cost, shipping, fees, returns, discounts, and ads. The leftover covers your fixed costs and then your profit.
What is contribution margin in simple terms?
Contribution margin is the money left from a sale after you subtract every cost that changes with that sale. That includes product cost, shipping, fees, returns, discounts, and ads. The leftover covers your fixed costs and then your profit.
Why is contribution margin better than gross margin for ecommerce?
Because most ecommerce costs live outside of COGS. Shipping and ads alone can eat 20 to 40 points of margin. Gross margin hides them. Contribution margin counts them, so it tells you if growth is profitable.
How do I calculate contribution margin per order?
Take the sale price, then subtract product cost, shipping, payment fees, the share of returns for that product, any discount, and the ad spend tied to that order. The number left is the order’s contribution margin.
What is a good contribution margin percentage?
For most DTC brands in 2026, 20% to 30% after ads is healthy. Beauty and supplements can run higher. Food and beverage often runs lower. Compare against your own past results first.
How does contribution margin set my ad budget?
Your contribution margin before ads is the most you can pay to acquire a customer before the order loses money. If that number is $27, do not pay $30 to get the sale. It bounds your maximum acquisition cost.