Quick Answer: The LTV to CAC ratio is the profit one customer brings you over a fixed period divided by what you paid to acquire them. Calculate it with contribution profit (not revenue), new customer CAC (not blended), and a stated window (usually 12 months). On that basis, healthy D2C brands land between 1.5:1 and 3:1. The famous 3:1 rule came from software, and if you apply it to revenue based LTV you will scale a business that is quietly losing money.
Here is the uncomfortable part. We ran one real order sheet through the four formulas that top ranking articles teach. Same brand. Same month. Same customers.
The answers were 5.97:1, 3.51:1, 2.18:1, and 1.49:1.
All four are “correct.” Only one should decide where your next $100,000 goes.
This guide shows you which one, the math behind it, benchmarks pulled straight from FY2025 SEC filings, and the payback number that matters more than the ratio itself.
What Is the LTV to CAC Ratio?
The LTV to CAC ratio compares what a customer is worth to what they cost.
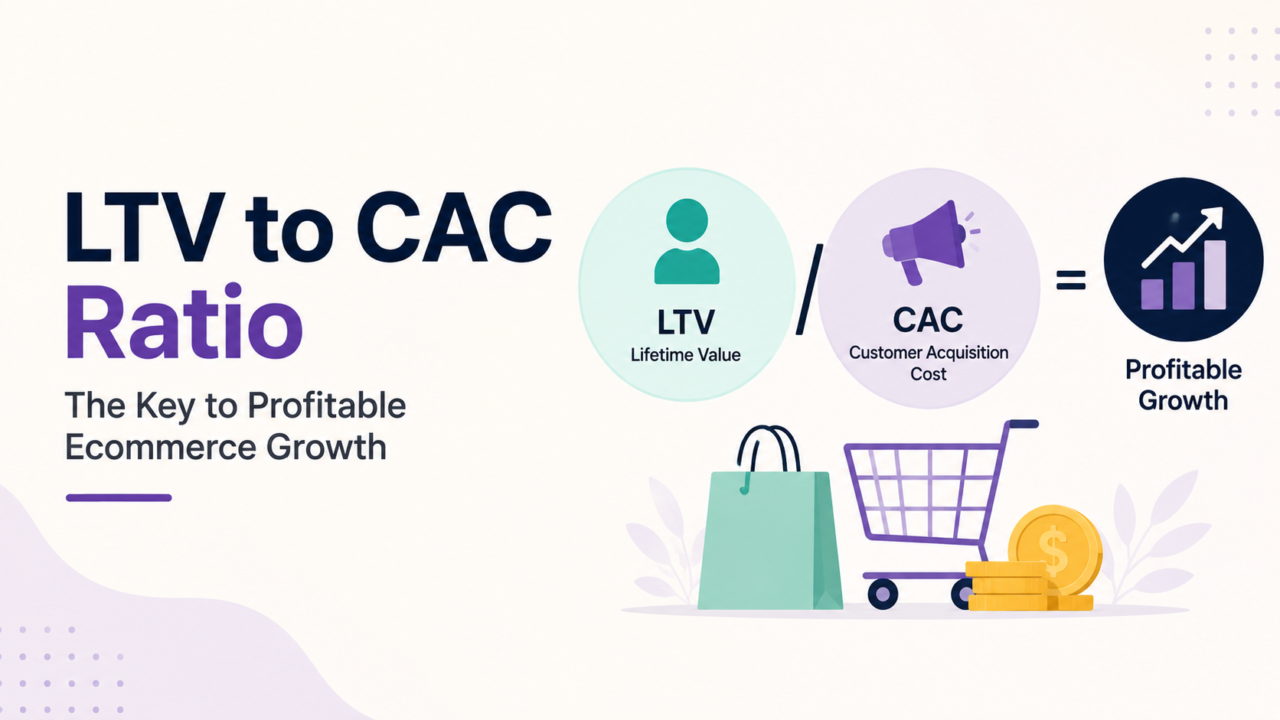
LTV to CAC = Customer Lifetime Value / Customer Acquisition Cost
Simple formula. The trouble is that “value” and “cost” both have four or five defensible definitions, and picking different ones changes your answer by 4x.
Two decisions drive everything:
- What counts as value. Revenue, gross profit, or contribution profit.
- What counts as cost. Ad spend only, or ad spend plus agency fees, creative, tools, and welcome discounts.
Get those wrong and the ratio becomes a number you show investors, not a number you run the business on.
Why founders look this up before hiring anyone
Because it answers one question: can I afford to grow?
If the ratio is strong, spend more. If it is weak, no new hire, no new channel, and no new agency fixes it. That is a unit economics problem wearing a staffing costume.
Four Formulas, Four Answers: The Test Nobody Runs
Most guides teach one formula and move on. So we took a single real order sheet and ran all four.
The brand: US skincare, about $230,000 a month.
| Input | Value |
|---|---|
| Average order value | $68.00 |
| Product cost (38% of AOV) | $25.84 |
| Pick, pack, shipping | $9.00 |
| Payment fees (2.9% + $0.30) | $2.27 |
| Returns allowance (about 3%) | $2.10 |
| Gross profit per order | $42.16 |
| Contribution profit per order | $28.79 |
| Orders per customer, 12 months | 3.1 |
| Acquisition spend, month | $120,000 |
| New customers that month | 2,000 |
| Total orders that month | 3,400 |
| New customer CAC | $60.00 |
| Blended CAC | $35.29 |
Now the four versions.
| Method | LTV | CAC | Ratio | Verdict |
|---|---|---|---|---|
| Revenue LTV / blended CAC | $210.80 | $35.29 | 5.97:1 | Fantasy |
| Revenue LTV / new customer CAC | $210.80 | $60.00 | 3.51:1 | Still fantasy |
| Gross profit LTV / new customer CAC | $130.70 | $60.00 | 2.18:1 | Closer |
| Contribution LTV / new customer CAC | $89.25 | $60.00 | 1.49:1 | The truth |
Look at the first row against the last. Method one says triple your ad spend tomorrow. Method four says you are barely above water.
The gap is exactly 4x, and it is entirely a measurement artifact. Nothing about the business changed.
Use method four. Contribution profit over new customer CAC, on a stated 12 month window. Everything below assumes that.
Fact check: what the top ranking pages get wrong
We read the pages currently ranking for this term. Two problems keep showing up.
Shopify’s guide explicitly builds LTV on gross revenue. The Shopify guide notes that some people use margin or profit, then bases its math on gross revenue and calls that the ecommerce standard. It goes on to recommend that ecommerce brands typically land between 3:1 and 4:1. Those two claims cannot both be safe advice. A 3:1 revenue ratio on a 42% contribution margin is roughly 1.26:1 in real money. That brand is not healthy. It is one CPM increase from underwater.
Daasity’s guide is closer. It defines LTV as average gross margin per customer, which is the right instinct. But its core LTV formula is published as an unfinished sentence with the actual math trapped inside an image, and the page is still dated 2023.
Neither page shows a worked contribution example, a cohort table, or a payback calculation. That is the gap this guide fills.
The WORTH Framework: Five Inputs to Fix Before You Divide
Five errors show up in almost every operator dashboard we open. Fix them in this order.
W: Window (pick a fixed period and say it out loud)
“Lifetime” is not a number. Nobody knows a customer’s lifetime until they are gone, and by then the data is useless.
Use a fixed window:
- 12 months for most D2C brands
- 6 months for fast repeat categories (coffee, supplements, pet food)
- 24 months for slow cycles (furniture, appliances, high ticket apparel)
Then state it in every report: “our 12 month LTV to CAC is X.” A ratio without a window is not a metric. It is a mood.
O: Order costs (contribution profit, not revenue)
The single biggest error. Founders multiply AOV by repeat orders and call it LTV. That is revenue.
Strip out every cost that moves with the order:
- Product cost (COGS)
- Pick, pack, and shipping
- Payment processing fees
- Returns and refunds
- Marketplace or channel commissions
What remains is contribution profit. That is the only money that can pay for ads, salaries, and rent. Build it line by line using our contribution margin for ecommerce guide.
Returns deserve their own warning. Most LTV models skip them entirely. In apparel, where return rates commonly run 20% to 30%, ignoring returns can overstate your ratio by a third on its own.
R: Real CAC (new customer, not blended)
Blended CAC divides total marketing spend by total orders, including repeat buyers who came back for free. That makes acquisition look cheap. It is not.
- New customer CAC = acquisition spend / new customers acquired
- Blended CAC = total marketing spend / total orders
Use new customer CAC in the ratio. Track blended separately as a cash number. Our cost per order guide covers the full picture.
Fold these into CAC, because they are real acquisition costs:
- Agency and freelancer fees
- Creative production and UGC
- First order discount codes and welcome offers
- Affiliate and influencer payouts
- Ad tools and tracking software
A $15 welcome code on a $68 order is acquisition spend. It just never appears in your ad platform.
T: Track by cohort, not by average
Blended average LTV mixes your 2023 customers (years to reorder) with last month’s (30 days). The average looks great and tells you nothing.
Cohort tracking means grouping customers by the month they first bought, then following that group forward.
Why it matters:
- You see whether new customers are getting better or worse
- You catch channel quality shifts in weeks, not quarters
- You compare month 3 to month 3, apples to apples
If your January cohort hit $52 of contribution by month 3 and your June cohort hit $34, you have a live problem, even though the blended average has not moved.
H: Hold to payback (the number that pays your bills)
The ratio tells you if the model works. Payback tells you if you survive until it does.
CAC payback = months until cumulative contribution profit per customer equals CAC.
A 3:1 ratio over 24 months with a 9 month payback strangles a self funded brand. A 1.8:1 ratio with a 45 day payback prints cash you can redeploy eight times a year.
For our example brand:
- Order 1: $28.79 cumulative (48% of CAC recovered)
- Order 2: $57.58 cumulative (still short of $60)
- Order 3: $86.37 cumulative (CAC cleared)
If order 3 typically lands in month 7, payback is 7 months. Every ad dollar is locked up for seven months before it comes back. That is the real growth ceiling, and the ratio alone would never have shown it.
Real Benchmarks From FY2025 SEC Filings
Most benchmark posts cite each other. We pulled these gross margins directly from company XBRL data in SEC EDGAR filings, so you can check them yourself.
| Company | Model | FY2025 revenue | FY2025 gross profit | Gross margin |
|---|---|---|---|---|
| Etsy | Marketplace | $2,883.5M | $2,065.7M | 71.6% |
| eBay | Marketplace | $11,100M | $7,931M | 71.5% |
| Olaplex | Beauty hybrid | $423.0M | $293.6M | 69.4% |
| FIGS | D2C apparel | $631.1M | $419.8M | 66.5% |
| YETI | D2C plus wholesale | $1,868.5M | $1,072.7M | 57.4% |
| Warby Parker | D2C vertical | $871.9M | $470.6M | 54.0% |
| Chewy | Subscription (Autoship) | $12,601.5M | $3,753.9M | 29.8% |
Source: SEC EDGAR company facts, FY2025 10-K filings. Chewy fiscal year ends February 2026; YETI fiscal year ends January 2026; others end December 2025.
Three things worth noticing:
- Marketplaces are not your benchmark. Etsy and eBay clear 71% gross margin with no inventory and no shipping. A D2C brand cannot get there. Comparing yourself to them is like a restaurant benchmarking against software.
- A 54% gross margin is normal, not weak. Warby Parker, a well run public D2C brand, runs there. If you are at 55% and beating yourself up, stop.
- Low margin can still win on frequency. Chewy runs under 30% gross margin and remains a strong business because Autoship customers reorder monthly. Margin times frequency beats margin alone.
None of these companies disclose CAC in their 10-K filings, because CAC is not a GAAP metric. Any published “Warby Parker CAC” number you see is modeled, not reported. Treat it accordingly.
The Max CAC Table: What You Can Actually Afford to Pay
Here is the calculation almost nobody publishes, and it is the one you can act on today.
Work backwards. Decide your target ratio, then solve for the highest CAC that still hits it.
Max CAC = (AOV x contribution margin % x orders per customer) / target ratio
Using our example brand’s $68 AOV and 3.1 orders over 12 months, and assuming roughly 20 points of AOV goes to shipping, fees, and returns:
| Gross margin | Contribution margin | 12 month contribution LTV | Max CAC at 2:1 | Max CAC at 2.5:1 | Max CAC at 3:1 |
|---|---|---|---|---|---|
| 70% | 50% | $105.40 | $52.70 | $42.16 | $35.13 |
| 60% | 40% | $84.32 | $42.16 | $33.73 | $28.11 |
| 50% | 30% | $63.24 | $31.62 | $25.30 | $21.08 |
| 40% | 20% | $42.16 | $21.08 | $16.86 | $14.05 |
| 30% | 10% | $21.08 | $10.54 | $8.43 | $7.03 |
Read the 40% gross margin row. To hit a 3:1 ratio, you would need to acquire customers for $14.05. In US paid social, in 2026, on a $68 AOV product. That is not a target. That is a fantasy.
This is the clearest proof that the 3:1 rule does not transfer. For most D2C margin structures, 3:1 on contribution profit demands a CAC nobody can hit. Which is exactly why so many brands quietly switch to revenue LTV: it is the only way to make the benchmark look achievable.
Run this table with your own numbers before your next budget meeting. If your actual CAC is above the 2:1 column, you have your answer.
Why the 3:1 Rule Came From Software (and Stayed There)
The 3:1 target and the 12 month payback rule were popularized by SaaS metrics writing aimed at venture backed software companies.
Software and physical products are different businesses:
| Factor | SaaS | Ecommerce D2C |
|---|---|---|
| Cost of the next unit | Near zero | 30% to 60% of price |
| Revenue timing | Contracted, monthly | Only when they choose to buy again |
| Churn visibility | Clear cancel event | Silent, they just stop |
| Margin on repeat sale | Almost pure profit | Same product cost, again |
| Typical cohort length | 24 to 60 months | 12 to 24 months |
In SaaS, year two revenue is nearly all profit. In ecommerce, order two costs you the product, the box, the shipping, and the payment fee all over again.
So a 3:1 measured on revenue can hide a business losing money per customer. And a 1.6:1 measured on contribution profit can be a healthy, cash generating brand.
What Is a Good LTV to CAC Ratio for Ecommerce?
Honest working bands, on a 12 month contribution basis with new customer CAC:
| Ratio | What it means | What to do |
|---|---|---|
| Below 1:1 | You lose money on every customer | Stop scaling. Fix margin or CAC now |
| 1:1 to 1.5:1 | Barely covering overhead | Fix repeat rate before spending more |
| 1.5:1 to 2.5:1 | Healthy for most D2C | Scale carefully, watch payback |
| 2.5:1 to 4:1 | Strong | Push spend, you are likely underinvesting |
| Above 4:1 | Underspending, or bad math | Recheck inputs, then buy more traffic |
A very high ratio is a warning too. It usually means one of two things. You are not buying enough traffic. Or your LTV window is too generous.
Ratios differ by category
- Consumables and subscriptions: higher ratios, faster payback. Repeat is structural. See subscription ecommerce.
- Fashion and apparel: returns eat contribution. Fold them in or your ratio is fiction.
- High ticket, one time purchase: the ratio roughly equals first order margin over CAC. Referrals are the only real lever.
- Marketplace sellers: commissions, fees, and ad costs all hit contribution. ACoS vs TACoS is the closest cousin on Amazon.
Five Mistakes That Break the Number
1. Counting gross revenue as value. The most common and most expensive error. See the four formula table above.
2. Leaving discounts out of CAC. Welcome codes are acquisition spend that never shows up in Ads Manager.
3. Trusting platform reported new customers. Meta and Google both claim the same buyer. Count new customers from your own store data, then allocate spend against it.
4. Averaging across channels. A branded search click and a cold TikTok ad bring very different buyers, with different CAC and different repeat rates. Split the ratio by channel or you will scale the wrong one.
5. Never updating it. Last Q4’s ratio is not today’s ratio. Rerun it monthly on the current cohort.
When Not to Use This Metric
Most guides never say this part.
Skip or deprioritize LTV to CAC when:
- You are under 6 months old. No repeat data exists. Use first order contribution margin instead.
- You just launched a new product line. Cohorts are not comparable yet.
- You are running a clearance or liquidation push. The goal is cash, not customer value.
- Your repeat rate is under 10%. You are effectively a single purchase business. Optimize first order margin and AOV.
- You need a weekly decision. The ratio moves too slowly. Use payback period and daily contribution after ad spend.
How to Improve Your LTV to CAC Ratio
Two levers. One is usually cheaper.
Lever 1: Raise LTV (usually cheaper)
- Fix the second purchase. The jump from one order to two is the highest leverage move in D2C. Start with turning first time buyers into repeat customers.
- Build the flows. Welcome, post purchase, replenishment, and winback sequences do the reordering work while you sleep. See ecommerce email marketing flows.
- Raise contribution per order. Bundles and cross sells lift LTV without touching repeat rate. Try post purchase cross sell.
- Give a reason to come back. A structured loyalty program shortens the gap between orders.
- Cut returns. Every avoided return is straight contribution profit. Start with returns management.
Retention economics have been documented for decades. Work popularized by Bain and Harvard Business Review argues that small gains in retention produce outsized profit gains. Be careful with the exact percentages you see quoted online, though. Most are repeated with no source you can trace.
Lever 2: Lower CAC
- Kill channels with high CAC and low repeat rate, even when their ROAS looks fine
- Recover lost sessions before paying for new ones, starting with abandoned cart recovery
- Ship more creative, because creative fatigue is usually the real cause of rising CAC
- Move budget to partners with proven repeat behavior, which is where profitable influencer marketing earns its keep
Build It in a Week
A practical order for a small team:
- Day 1 and 2: Export 18 months of orders. Tag each as first or repeat by customer ID.
- Day 3: Build contribution profit per order. One row per SKU family if margins vary.
- Day 4: Pull acquisition spend by month. Add agency fees, creative, and welcome discounts.
- Day 5: Build the cohort table. Rows are first purchase month, columns are months 1 to 12, cells are cumulative contribution per customer.
- Day 6: Calculate new customer CAC per month and place it beside each cohort.
- Day 7: Compute the ratio and the payback month. Set a monthly refresh and stop touching it in between.
One sheet. Refreshed monthly. Readable in 60 seconds.
The 60 second self audit
Answer yes or no:
- Does my LTV use contribution profit, not revenue?
- Does my CAC use new customers only?
- Do welcome discounts sit inside CAC?
- Is my window stated in months?
- Do I know my payback month?
- Can I split the ratio by channel?
Six yeses means your number is trustworthy. Fewer than four means you are making budget decisions on a guess.
Frequently Asked Questions
What is a good LTV to CAC ratio for ecommerce?
On a 12 month contribution profit basis with new customer CAC, most healthy D2C brands sit between 1.5:1 and 3:1. Below 1:1 you lose money on every customer. Above 4:1 usually means you are not spending enough on acquisition.
Should I use revenue or profit for LTV?
Use contribution profit. Revenue based LTV ignores product cost, shipping, fees, and returns. In ecommerce those can eat 55% or more of the order. That makes the ratio look three to four times better than it is.
What is the difference between blended CAC and new customer CAC?
Blended CAC divides total marketing spend by all orders, including repeat purchases. New customer CAC divides acquisition spend by only first time buyers. Use new customer CAC in the ratio, since repeat orders were not acquired by that spend.
Why is the 3:1 rule wrong for D2C brands?
The 3:1 rule came from subscription software, where the next unit costs almost nothing and revenue renews on its own. Ecommerce pays full product and shipping cost on every repeat order. For a brand at 40% gross margin, hitting 3:1 on contribution profit would require a CAC near $14 on a $68 order, which is not achievable in US paid media.
How long should my LTV window be?
Use 12 months for most D2C brands. Use 6 months for fast repeat categories like coffee, supplements, and pet food. Use 24 months for slow cycles like furniture or high ticket apparel. State the window every time you report the number.
What is CAC payback period and why does it matter more?
CAC payback is the number of months it takes to earn back what you paid for a customer. It matters more when cash is tight. A strong ratio with a 9 month payback can still drain your working capital, because payback months are the months of acquisition spend you must fund yourself.
Can I calculate LTV to CAC per channel?
Yes, and you should. Tag first orders by acquisition source, then track each source’s cohort forward. Two channels can post the same ROAS and very different repeat rates. That gap decides where your next dollar goes.
How do I know the most I can pay to acquire a customer?
Divide your 12 month contribution LTV by your target ratio. If contribution profit per order is $28.79 and customers order 3.1 times, your contribution LTV is $89.25. At a 2:1 target, your maximum CAC is $44.63.
Do public companies report their LTV to CAC ratio?
No. CAC and LTV are not GAAP metrics, so 10-K filings do not include them. Filings disclose revenue, gross profit, and operating expense buckets. Any public company CAC figure you see online is modeled from those inputs, not reported by the company.
How often should I recalculate it?
Monthly. Cohorts mature, CAC moves with auction pressure and creative fatigue, and margins shift with supplier and shipping costs. A ratio older than a quarter is history, not a decision tool.
The Real Bottleneck Is Execution
Most brands do not have a measurement problem for long. Once the cohort sheet exists, the answer is obvious in an afternoon.
The problem is what comes next.
Better repeat rate means someone owns flows, post purchase, catalog quality, and support speed. Every single week. Lower CAC means someone ships new creative and cuts weak channels fast.
That is operating work, not strategy work. It does not happen between supplier calls.
AcquireX builds dedicated offshore ecommerce teams that own this work end to end. Performance marketing. Catalog. Customer support. Supply chain. Not a vendor you chase. A team inside your business that owns the numbers.
Your ratio says fix retention and cut CAC. Nobody on your team has the hours. That is where we come in.
Talk to us about a dedicated team, or see how our performance marketing and growth team buys against contribution targets instead of vanity ROAS.