Summary: RFM analysis scores every customer on three things from your order history: recency (how long since their last order), frequency (how many orders they placed) and monetary value (how much they spent). Each gets a 1 to 5 score, and the combination sorts customers into segments such as Champions, At Risk and Lost, so you know who to email, who to win back and who to stop discounting.
Most ecommerce brands treat their customer list as one audience. Everyone gets the same newsletter, the same sitewide discount and the same win-back flow. The result is predictable: your best customers get trained to wait for coupons, lapsing customers slip away without anyone noticing, and one-time buyers who were never going to return keep absorbing send volume and ad spend.
RFM analysis fixes that with data you already have. It needs no new tools, no tracking pixels and no survey, just orders. This guide explains how RFM works, how to score customers with a worked example, the segments to use and what to do with each one, plus ready-to-adapt SQL and Python for teams that want to automate it. It also covers the details most guides skip: choosing the right window for your repurchase cycle, using margin instead of revenue, and measuring whether your RFM campaigns actually move revenue.
What is RFM analysis?
RFM analysis is a customer segmentation method that ranks customers by three purchase behaviors:
- Recency (R): the number of days since the customer’s most recent order. Fewer days means a higher score.
- Frequency (F): the number of orders the customer placed within the analysis window.
- Monetary value (M): the total the customer spent in that window, or better, the gross margin they generated.
Each dimension is scored, usually from 1 to 5, and the three scores are written together as an RFM code. A customer scored 5, 4 and 3 has the code 543. The code is a label, not a number to add up: 543 describes a customer who bought very recently, buys often and spends in the middle of your range.
The logic behind RFM is simple: customers who bought recently and often are the most likely to buy again, and customers who spend more are worth more effort to keep. That makes it one of the fastest ways to decide where your retention budget should go.
Why does RFM analysis matter for ecommerce brands?
Acquisition costs on paid social and search keep rising, so profit increasingly comes from second, third and tenth orders. RFM gives you a practical way to manage that repeat revenue:
- Better targeting: send launches and early access to Champions, and save discounts for customers who actually need a reason to come back.
- Protected margin: stop handing 20% codes to people who would have bought at full price anyway.
- Earlier churn warnings: see high-value customers drifting into the At Risk zone while there is still time to act.
- Smarter ad audiences: build lookalike audiences from your best segments and exclude recent buyers from prospecting campaigns.
- Cleaner email deliverability: suppress long-lost, unengaged customers instead of mailing them forever.
RFM also connects directly to unit economics. If you track LTV to CAC ratio, RFM shows you which customers create that lifetime value and which ones drag the average down.
What data do you need for RFM analysis?
You need one order-level export with four fields: a customer ID (email or platform customer ID), order ID, order date and order value. Shopify, WooCommerce, BigCommerce and most marketplaces can export this. Before scoring, clean it:
- Remove cancelled, fully refunded and test orders, and subtract partial refunds from order value.
- Exclude shipping and sales tax from monetary value so it reflects what the customer actually spent on products.
- Merge duplicate customer records, such as the same shopper checking out as a guest and with an account.
- Decide how to treat wholesale or B2B accounts. They usually distort a D2C analysis and are better scored separately.
- If you can, add order-level gross margin. Our guide to contribution margin for ecommerce explains how to calculate it.
How do you calculate RFM scores step by step?
1. Choose an analysis window and a snapshot date
Frequency and monetary value only make sense inside a defined window. Twelve months is a common default because it captures seasonal buyers. Match it to your repurchase cycle: a coffee or supplement brand with monthly reorders can use six months, while a furniture or mattress brand may need 24 to 36 months. The snapshot date is the day you measure recency from, usually the day you run the analysis.
2. Calculate raw R, F and M values for each customer
Roll orders up to one row per customer: days between the last order and the snapshot date, the count of distinct orders in the window, and the sum of net order value (or margin) in the window.
3. Score each dimension from 1 to 5
There are two common scoring methods, and you can mix them:
| Method | How it works | Best for | Watch out for |
|---|---|---|---|
| Quintiles | Rank customers and split them into five equal-sized groups per dimension | Large customer bases with spread-out values; quick comparisons over time | Frequency often fails because most ecommerce customers have exactly one order, so ties break quintiles |
| Business rules | Set fixed thresholds, such as R5 = ordered in the last 30 days or F3 = three orders | Small catalogs, clear repurchase cycles, and stable segments month to month | Thresholds need revisiting when your business or seasonality changes |
A practical default for most D2C brands: use rules tied to your median days between orders for recency, simple order counts for frequency (1, 2, 3, 4 to 5, 6 or more), and quintiles for monetary value.
4. Combine scores into codes and map codes to segments
With five scores per dimension there are 125 possible codes, far too many to market to. Group them into eight to eleven named segments, mostly driven by recency and frequency, and use monetary value to prioritize within each segment.
5. Refresh on a schedule
Recalculate monthly, or weekly if you send campaigns weekly. Customers move between segments as they buy or go quiet, and those movements, such as Loyal to At Risk, are often the most useful triggers you have.
What does a worked RFM example look like?
Here is an illustrative example with ten customers from a home goods brand. The figures are example data, not benchmarks. The snapshot covers the last 12 months, and the brand’s median gap between orders is about 45 days, so recency rules are: R5 is 30 days or fewer, R4 is 31 to 60, R3 is 61 to 120, R2 is 121 to 240 and R1 is more than 240. Frequency uses order counts (six or more orders scores 5), and monetary value is scored by ranking spend into five groups of two customers.
| Customer | Days since last order | Orders (12 mo) | Spend (12 mo) | R | F | M | RFM code | Segment |
|---|---|---|---|---|---|---|---|---|
| C01 | 12 | 7 | $1,240 | 5 | 5 | 5 | 555 | Champions |
| C02 | 25 | 3 | $310 | 5 | 3 | 4 | 534 | Loyal |
| C03 | 9 | 1 | $85 | 5 | 1 | 2 | 512 | New customers |
| C04 | 48 | 5 | $690 | 4 | 4 | 4 | 444 | Champions |
| C05 | 95 | 2 | $140 | 3 | 2 | 3 | 323 | Needs attention |
| C06 | 160 | 6 | $980 | 2 | 5 | 5 | 255 | Can’t lose them |
| C07 | 210 | 1 | $60 | 2 | 1 | 1 | 211 | About to sleep |
| C08 | 300 | 2 | $120 | 1 | 2 | 2 | 122 | Hibernating |
| C09 | 420 | 1 | $45 | 1 | 1 | 1 | 111 | Lost |
| C10 | 38 | 2 | $260 | 4 | 2 | 3 | 423 | Potential loyalists |
A few things stand out. C06 has spent $980 across six orders but has not bought in 160 days: that is the customer worth a personal win-back, not a generic coupon. C03 and C10 are recent but light buyers, so the job is to earn the second and third order. C09 has one small order more than a year ago and should get one reactivation attempt before being moved to a low-frequency list.
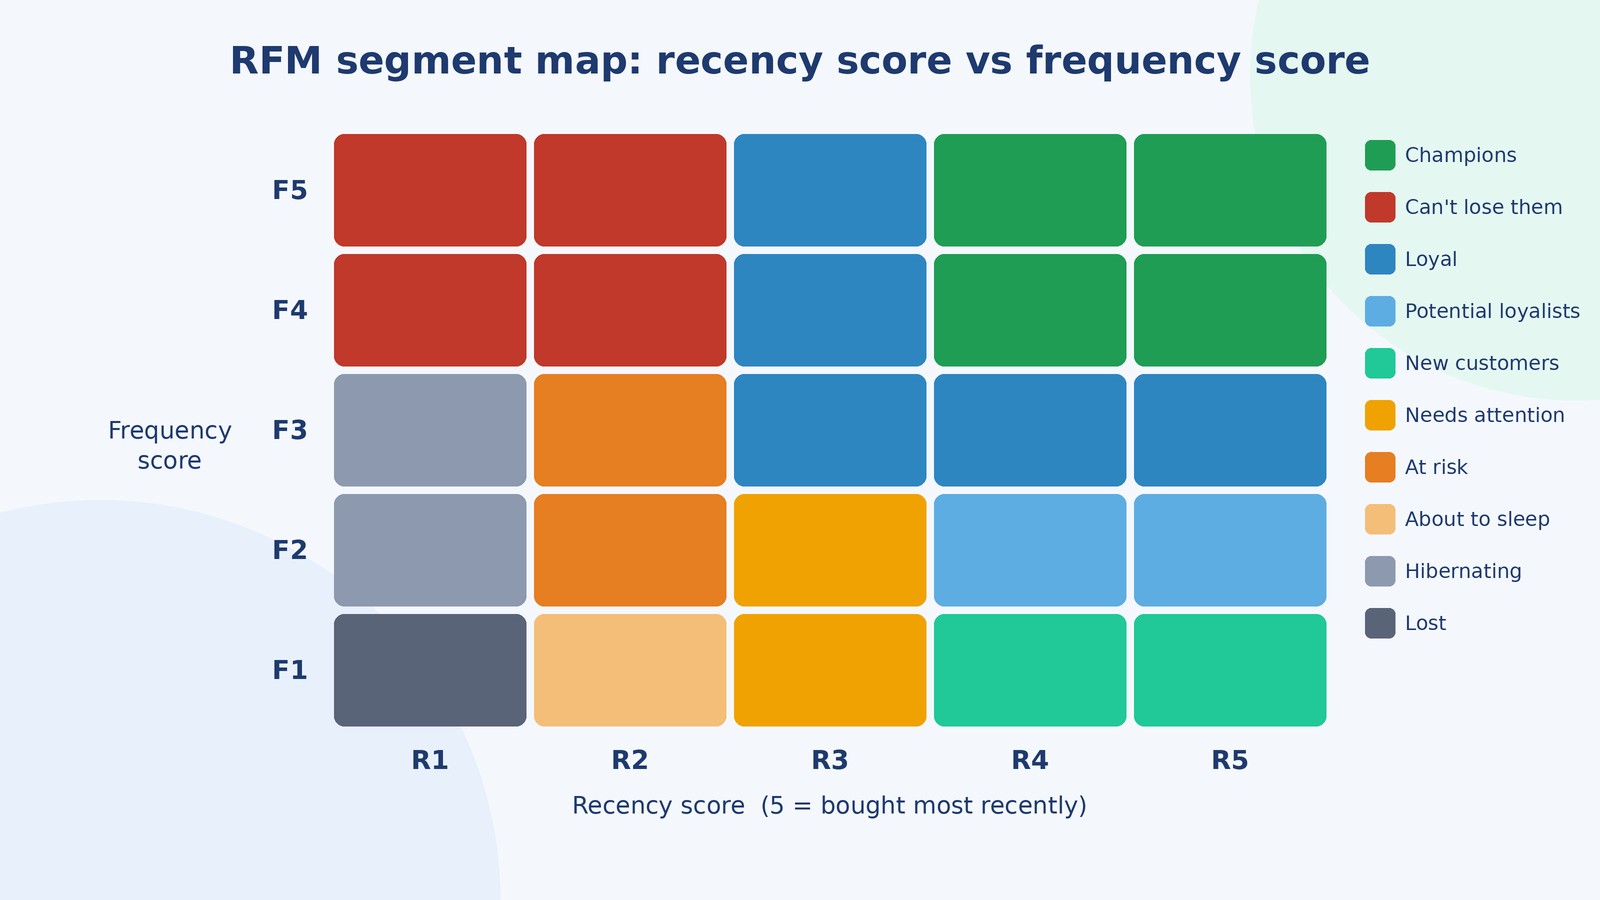
What are the standard RFM segments and how should you market to each?
Segment names vary by tool, but most RFM models land on a similar set. The table below uses the recency and frequency rules from the example above and pairs each segment with a goal and a play.
| Segment | R and F scores | Goal | What to send | Discount stance |
|---|---|---|---|---|
| Champions | R4 to 5, F4 to 5 | Reward and amplify | Early access, launches, referral asks, review requests | Avoid; use perks instead |
| Loyal | R3 to 5, F3 (or R3, F4 to 5) | Increase frequency | Replenishment reminders, cross-sell, loyalty tier progress | Light, tied to new categories |
| Potential loyalists | R4 to 5, F2 | Earn the third order | Product education, bundles, the item that usually leads to order three | Small, time-limited |
| New customers | R4 to 5, F1 | Earn the second order | Post-purchase onboarding, how-to content, a second-purchase incentive | Moderate, one time |
| Needs attention | R3, F1 to 2 | Re-engage before they lapse | Reminders tied to what they bought, best-sellers, restocks | Moderate |
| About to sleep | R2, F1 | Remind and reactivate | Popular products, new arrivals, social proof | Moderate |
| At risk | R2, F2 to 3 | Prevent churn | Multi-step win-back by email and SMS, feedback request | Escalating if no response |
| Can’t lose them | R1 to 2, F4 to 5 | Recover high-value customers | Personal outreach, service check-in, premium win-back | Generous if margin allows |
| Hibernating | R1, F2 to 3 | Last attempt | Seasonal or new-collection news | One strong offer |
| Lost | R1, F1 | Protect deliverability | One reactivation message, then suppress or reduce frequency | One offer, then stop |
Most of these plays live in automated flows. If you are building them from scratch, our guide to ecommerce email marketing flows covers the welcome, post-purchase and win-back sequences that RFM segments plug into, and the first-time to repeat buyer playbook goes deeper on the New customers and Potential loyalists segments.
Should monetary value use revenue or margin?
Use margin when you can. Revenue rewards customers who buy heavily discounted or low-margin items, and it ignores returns behavior. A customer who spent $900 but returned half of it and only bought during sales may be worth less than one who spent $500 at full price.
Scoring M on gross margin after discounts and returns turns RFM from a revenue map into a profit map. It also stops you from rewarding the exact discount-seeking behavior you want to reduce. A useful extra is a price-sensitivity flag: mark customers whose orders mostly used a discount code, and keep them out of full-price campaigns where a code would only cut margin.
How do you run RFM analysis in a spreadsheet, SQL or Python?
In a spreadsheet
Export orders, build a pivot table with customer ID as rows and the maximum order date, count of order IDs and sum of order value as values. Add a days-since column, then score with nested IF formulas for rule-based recency and frequency and PERCENTRANK or PERCENTILE for monetary value. This works well up to tens of thousands of customers.
In SQL
If your orders live in a warehouse such as BigQuery, Snowflake or Postgres, a single query scores everyone. The example below uses Postgres syntax and quintiles via NTILE. Ordering recency descending puts the most recent buyers in group 5.
-- One row per customer, last 12 months, completed orders only
WITH base AS (
  SELECT customer_id,
         DATE_PART('day', DATE '2026-11-01' - MAX(order_date)) AS recency_days,
         COUNT(DISTINCT order_id)                             AS frequency,
         SUM(net_revenue)                                     AS monetary
  FROM orders
  WHERE order_date >= DATE '2026-11-01' - INTERVAL '12 months'
    AND status = 'completed'
  GROUP BY customer_id
)
SELECT customer_id, recency_days, frequency, monetary,
       NTILE(5) OVER (ORDER BY recency_days DESC) AS r_score,
       NTILE(5) OVER (ORDER BY frequency ASC)     AS f_score,
       NTILE(5) OVER (ORDER BY monetary ASC)      AS m_score
FROM base;
Remember that NTILE splits ties arbitrarily, so with mostly one-order customers it can put identical customers in different frequency groups. Swap the frequency line for a CASE statement on order counts if that happens.
In Python
For analysts who prefer notebooks, pandas does the same job in a few lines:
import pandas as pd

orders = pd.read_csv("orders.csv", parse_dates=["order_date"])
snapshot = pd.Timestamp("2026-11-01")
window = orders[orders.order_date >= snapshot - pd.DateOffset(months=12)]

rfm = window.groupby("customer_id").agg(
    recency=("order_date", lambda d: (snapshot - d.max()).days),
    frequency=("order_id", "nunique"),
    monetary=("net_revenue", "sum"),
)
# Rule-based recency and frequency, quintiles for monetary
rfm["R"] = pd.cut(rfm.recency, [-1, 30, 60, 120, 240, 10**6], labels=[5, 4, 3, 2, 1]).astype(int)
rfm["F"] = pd.cut(rfm.frequency, [0, 1, 2, 3, 5, 10**6], labels=[1, 2, 3, 4, 5]).astype(int)
rfm["M"] = pd.qcut(rfm.monetary.rank(method="first"), 5, labels=[1, 2, 3, 4, 5]).astype(int)
rfm["code"] = rfm.R.astype(str) + rfm.F.astype(str) + rfm.M.astype(str)
From there, apply your segment rules, write the segment back to your email or SMS platform as a customer property or tag, and schedule the script to run monthly.
How does RFM compare with other segmentation methods?
| Method | Based on | Strength | Limitation |
|---|---|---|---|
| RFM analysis | Order history | Simple, explainable, uses data you already have | Backward-looking; ignores browsing and product affinity |
| Predictive CLV | Statistical or machine learning models on order history | Forecasts future value and churn probability | Needs more data and expertise; harder to explain to the team |
| Cohort analysis | Customers grouped by first purchase month or channel | Shows retention trends over time | Describes groups, not which individual to target |
| Behavioral segmentation | Site and app activity, product views, engagement | Captures intent before purchase | Needs tracking and is noisier |
| Zero-party segmentation | What customers tell you in quizzes and surveys | Captures preferences and motivations | Coverage limited to customers who answer |
These methods work best together. RFM tells you who is valuable and who is slipping, while post-purchase surveys tell you why they bought. If you have used ABC analysis for inventory, RFM is the customer-side equivalent: it tells you where to concentrate attention instead of treating every record the same.
How do you put RFM segments to work across channels?
- Email and SMS: sync segments as tags or properties and use them in flow branches and campaign audiences. Champions get launches first; At Risk customers enter a win-back sequence. Our SMS marketing guide for D2C covers consent rules before you text lapsing customers.
- Paid social and search: upload Champions and Loyal lists as seed audiences for lookalikes, exclude recent buyers from prospecting, and run modest retargeting budgets against Can’t lose them.
- Loyalty programs: invite Champions and Loyal customers into VIP tiers rather than offering the program to everyone. See our ecommerce loyalty program guide for structures that protect margin.
- Customer service: flag Champions and Can’t lose them in your help desk so agents can prioritize their tickets and approve goodwill gestures faster.
- Merchandising: look at what Champions bought first. Those products are often your best acquisition offers.
How do you measure whether RFM marketing is working?
Segmenting is easy; proving it made money is the hard part. Track:
- Segment migration: the share of customers moving up (for example, New to Potential loyalist) or down (Loyal to At risk) each month.
- Repeat purchase rate and time to second order for new customers.
- Win-back rate: the share of At risk and Can’t lose them customers who order again within 60 or 90 days.
- Revenue and margin per recipient by segment, not just open and click rates.
- Incremental lift: hold out a random 10% of a segment from a campaign and compare purchase rates. Without a holdout, you cannot tell whether a discount drove the order or just subsidized one that was coming anyway.
At the business level, RFM work should show up in blended efficiency. If repeat revenue grows while marketing spend stays flat, your marketing efficiency ratio improves.
What are the most common RFM analysis mistakes?
- Using a window that ignores your repurchase cycle. A 90-day window for a brand whose customers reorder every six months labels most good customers as lost.
- Relying on quintiles for frequency. When 70% of customers have one order, quintiles produce meaningless splits. Use order-count rules.
- Treating the RFM code as a sum. 515 and 155 both add to 11 but describe opposite customers.
- Scoring revenue without returns. Serial returners can look like Champions.
- Building segments nobody uses. Every segment needs a defined message, channel, frequency and discount ceiling, or it is just a label.
- Running it once. RFM is only useful when refreshed; stale segments send win-back offers to customers who bought last week.
- Discounting everyone below Champions. Start win-backs with value and reminders, and escalate incentives only when customers do not respond.
When should you get help with RFM and retention marketing?
RFM is simple to start but takes steady work to run well: clean exports, monthly refreshes, synced segments, flow maintenance, holdout tests and creative for ten audiences. Many growing brands set it up once and let it drift.
AcquireX’s performance marketing and growth services include customer segmentation, lifecycle email and SMS, retention-focused paid media and reporting, run by a dedicated team that works as an extension of yours. We can build your RFM model, wire the segments into your email, SMS and ad platforms, and report on segment migration and incremental revenue every month. If your support team also needs to prioritize high-value customers, our customer service management team can apply the same segments in your help desk.
Want to know which of your customers are Champions and which are about to churn? Book a call with AcquireX and we will walk through your order data and the retention plays that fit your brand.
Key takeaways
- RFM analysis scores customers on recency, frequency and monetary value using only order history.
- Match the analysis window and recency thresholds to your repurchase cycle, not a generic default.
- Use order-count rules for frequency and margin rather than revenue for monetary value when possible.
- Group 125 possible codes into eight to eleven segments, each with a clear goal, message, channel and discount ceiling.
- Refresh monthly, act on segment movements, and measure results with holdout groups.
Frequently asked questions
What is RFM analysis in simple terms?
RFM analysis is a way to rank customers by how recently they bought, how often they buy and how much they spend. Each customer gets a score from 1 to 5 on each measure, and the combination places them in a segment such as Champions, At Risk or Lost, which tells you how to market to them.
What is a good RFM score?
The best possible code on a 1 to 5 scale is 555: a customer who bought very recently, buys often and is in your top spending group. In practice, any customer with high recency and frequency scores (4 or 5) is valuable. Low scores are not bad in themselves; they tell you which customers need a different approach.
How often should you update RFM segments?
Monthly works for most ecommerce brands. Brands with fast repurchase cycles or weekly campaigns should refresh weekly. The key is to refresh before each major send so customers who just bought do not receive win-back offers.
What time period should RFM analysis cover?
Twelve months is a sensible default because it includes seasonal buyers. Shorten it to six months for consumables that are reordered monthly, and extend it to two or three years for high-ticket or infrequent purchases such as furniture.
Can you do RFM analysis in Shopify?
Yes. You can export orders or customers from Shopify and score them in a spreadsheet, and Shopify’s built-in customer segmentation lets you filter on fields like order count, amount spent and last order date. Many email platforms that integrate with Shopify, such as Klaviyo, also offer RFM-style segmentation.
What is the difference between RFM analysis and customer lifetime value?
RFM describes past buying behavior and groups customers into segments. Customer lifetime value estimates the total value a customer will generate over the relationship. RFM is simpler and easier to act on, while predictive CLV is better for forecasting and budget decisions. Many brands use both.
Is RFM analysis useful for B2B or wholesale ecommerce?
Yes, with adjustments. Score accounts rather than individual buyers, use longer windows that reflect contract and reorder cycles, and treat a falling order frequency as an early signal for your account managers to step in.
What are the limitations of RFM analysis?
RFM only looks at past purchases, so it misses browsing intent, product preferences and why customers buy. It also struggles with brands where most customers have one order. Combine it with product affinity, survey data or predictive models for a fuller picture.