Your sales team is busy. Calls go out. Demos get booked. But revenue still feels random.
That usually means you are tracking the wrong numbers. Or too many of them.
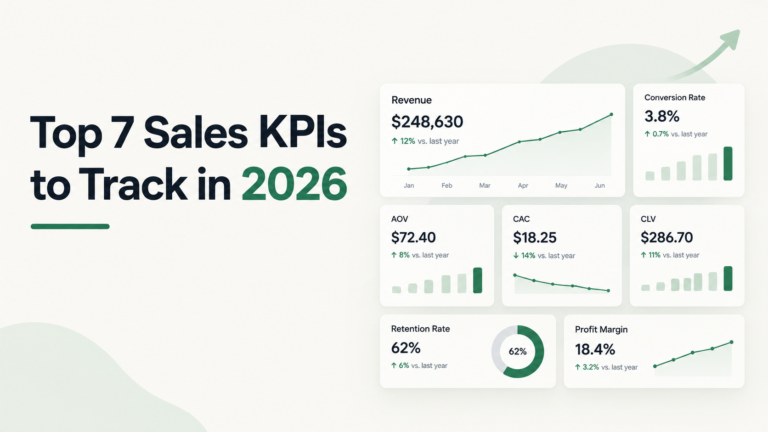
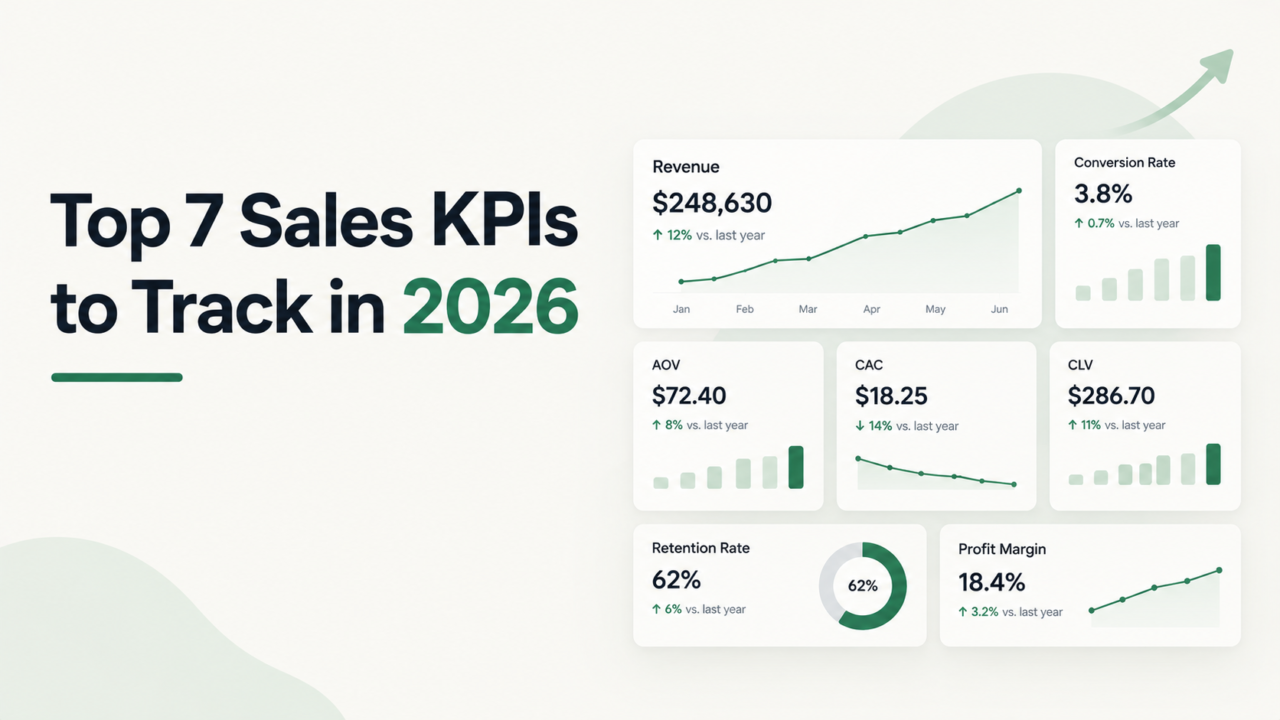
Here are the 7 sales KPIs that actually matter:
- Quota attainment (are we hitting the target?)
- Lead response time (how fast do we reply?)
- Lead-to-customer conversion rate (how many leads buy?)
- Average deal size (how much does each deal bring in?)
- Sales cycle length (how long does a deal take?)
- Customer acquisition cost (what does a new customer cost?)
- Customer lifetime value (what is a customer worth over time?)
Below, you get the formula for each one, a worked USD example, and a warning sign to watch.
You also get:
- 8 bonus KPIs for when your team grows
- A sample KPI scorecard you can copy
- The best KPIs for DTC vs. B2B wholesale teams
- A 20-minute weekly routine (the DIAL review) to act on the numbers
What Is a Sales KPI?
A sales KPI (key performance indicator) is a number that shows if your sales team is moving toward a goal.
Metric vs. KPI:
- A metric is any number you can count. Example: calls made.
- A KPI is a metric tied to a business goal. Example: revenue against quota.
Every KPI is a metric. Most metrics are not KPIs.
Leading vs. Lagging Sales KPIs
This is the simplest way to sort your KPIs.
- Leading KPIs predict what will happen. You can still change them this week.
- Lagging KPIs show what already happened. They are the final score.
| KPI | Type | Why |
|---|---|---|
| Lead response time | Leading | Faster replies lead to more qualified leads |
| Sales cycle length | Leading | Stuck deals warn you before revenue drops |
| Conversion rate | Leading and lagging | It shows past results and predicts next month |
| Average deal size | Lagging | It is set once the deal closes |
| Quota attainment | Lagging | It is the final score |
| CAC | Lagging | You see it after the money is spent |
| Customer lifetime value | Lagging | It builds over months or years |
The rule: Coach reps on leading KPIs. Report lagging KPIs to the founder or board.
If you only watch lagging numbers, you find problems a month too late.
Why Most Teams Track the Wrong Sales KPIs
Most dashboards are full of activity numbers. Calls. Emails. Meetings.
Those are easy to count. But they do not tell you if money is coming in.
And reps already have little time to sell. Salesforce surveyed 7,775 sales professionals and found reps spend just 28% of their time actually selling (Salesforce State of Sales research). A bloated dashboard eats into that time even more.
The fix is simple:
- Track a small set of KPIs.
- Make sure each one connects to revenue.
- Review them on a fixed schedule.
Quick View: The 7 Sales KPIs at a Glance
| KPI | Formula | What It Tells You | Review |
|---|---|---|---|
| Quota attainment | Revenue closed ÷ Target × 100 | Are we on track? | Weekly |
| Lead response time | Total reply time ÷ Leads | Are we fast enough? | Daily |
| Conversion rate | New customers ÷ Leads × 100 | Is the process working? | Weekly |
| Average deal size | Revenue from won deals ÷ Won deals | Are deals getting bigger? | Monthly |
| Sales cycle length | Total days to close ÷ Won deals | Is the pipeline stuck? | Monthly |
| CAC | (Sales cost + Marketing cost) ÷ New customers | Are we paying too much? | Monthly |
| Customer lifetime value | Order value × Orders per year × Years × Gross margin % | Is growth profitable? | Quarterly |
1. Quota Attainment
What it is: How much revenue your team closed compared to the target.
Formula:
Quota attainment = (Revenue closed ÷ Sales target) × 100
Example:
- Monthly target: $90,000
- Revenue closed: $76,500
- Quota attainment: 76,500 ÷ 90,000 = 85%
Why it matters: This is the scoreboard. Every other KPI on this list explains why this number went up or down.
Warning sign: Reps hit 150% one month and 40% the next. That points to a target problem or a pipeline problem, not a people problem.
Pro tip: Check it weekly, not at month end. By day 28, it is too late to fix.
2. Lead Response Time
What it is: The average time it takes your team to reply to a new lead.
Formula:
Lead response time = Total time to first reply ÷ Number of leads
Why it matters: Leads go cold fast. A Harvard Business Review study audited 2,241 US companies. Firms that replied within an hour were nearly 7 times as likely to qualify the lead as firms that waited even an hour longer. The average first reply? 42 hours (HBR, The Short Life of Online Sales Leads).
Warning sign: Leads that come in after 5 PM or on weekends wait until Monday.
How to improve it:
- Route leads to a rep automatically in your CRM.
- Set an alert when a lead has no reply after 15 minutes.
- Cover more hours with a team in another time zone.
Most competitor lists skip this KPI. That is a mistake. It is one of the cheapest numbers to fix, and it lifts conversion rate right after.
Need help with routing? See our guide on sales automation that removes pipeline bottlenecks.
3. Lead-to-Customer Conversion Rate
What it is: The share of leads that become paying customers.
Formula:
Conversion rate = (New customers ÷ Total leads) × 100
Example:
- Leads this month: 300
- New customers: 24
- Conversion rate: 24 ÷ 300 = 8%
Why it matters: It shows if your sales process works. More leads will not help if the process leaks.
Watch out: Our old version of this article used “total visitors” in this formula. That measures your website, not your sales team. Use leads for sales. Use visitors for site conversion.
Warning sign: Conversion drops while lead volume rises. That often means lead quality fell. Check the source.
Go deeper:
4. Average Deal Size
What it is: The average revenue from each won deal. In DTC, this is close to average order value (AOV).
Formula:
Average deal size = Revenue from won deals ÷ Number of won deals
Example: 12 wholesale deals bring in $54,000. Average deal size = $4,500.
Why it matters: Growing deal size is often easier than finding more leads. Bundles, volume pricing, and upsells all push this number up. (See how Shopify bundles raise average order value.)
Warning sign: Deal size climbs, but so does the discount rate. You are buying bigger deals with margin.
5. Sales Cycle Length
What it is: How many days it takes to close a deal, from first contact to payment.
Formula:
Sales cycle length = Total days to close all won deals ÷ Number of won deals
Why it matters: A shorter cycle means cash comes in sooner. It also means your team can handle more deals each month.
Warning sign: Deals sit in one stage (like “proposal sent”) for weeks. Find that stage and fix it first.
How to shorten it:
- Send a pricing sheet before the first call.
- Book the next step before ending every call.
- Use CRM tools to flag deals with no activity in 7 days.
6. Customer Acquisition Cost (CAC)
What it is: What you spend to win one new customer.
Formula:
CAC = (Total sales cost + Total marketing cost) ÷ New customers
Note the brackets. Add the costs first, then divide. Many articles (our old one included) leave the brackets out, which gives the wrong answer.
Example:
- Sales + marketing spend: $18,000
- New customers: 40
- CAC: 18,000 ÷ 40 = $450
Warning sign: CAC rises three months in a row while conversion rate stays flat. Your ads or lead sources are getting more expensive.
7. Customer Lifetime Value (CLV)
What it is: The gross profit a customer brings you over the full relationship.
Formula (simple version):
CLV = Average order value × Orders per year × Years as a customer × Gross margin %
Example (wholesale account):
- Average order: $4,500
- Orders per year: 3
- Years as a customer: 2
- Gross margin: 40%
- CLV: 4,500 × 3 × 2 × 0.40 = $10,800
Pair it with CAC. In this example, $10,800 ÷ $450 gives an LTV to CAC ratio of 24 to 1. Very healthy. Read our full breakdown of the LTV to CAC ratio for ecommerce.
Track retention and churn with it:
Retention rate = ((Customers at end − New customers) ÷ Customers at start) × 100 Churn rate = (Customers lost ÷ Customers at start) × 100
Example: You start with 50 accounts. You win 12 and lose 6. You end with 56.
- Retention: (56 − 12) ÷ 50 = 88%
- Churn: 6 ÷ 50 = 12%
Some popular guides say retention = 1 ÷ churn. That is wrong. With 12% churn, it would give you 833%. Retention and churn add up to 100% when you measure the same group.
Support quality drives repeat buyers too. See the customer support KPIs that predict retention.
8 Bonus Sales KPIs to Add as Your Team Grows
Start with the 7 KPIs above. Once they are steady, add the ones below that fit your model.
8. Win Rate
What it is: The share of closed deals your team won.
Win rate = (Deals won ÷ (Deals won + Deals lost)) × 100
Example: 12 deals won and 36 lost. Win rate = 12 ÷ 48 = 25%.
How it differs from conversion rate: Conversion rate counts all leads. Win rate only counts deals that reached a decision. It tells you how good your team is at closing.
9. Pipeline Coverage
What it is: How much open pipeline you have compared to your target.
Pipeline coverage = Open pipeline value ÷ Sales target
Example: $270,000 in open deals against a $90,000 target = 3x coverage.
Rule of thumb: Many sales leaders aim for about 3x. Your right number depends on your win rate. With a 25% win rate, you need about 4x to hit target.
10. Forecast Accuracy
What it is: How close your sales forecast was to what actually closed.
Forecast accuracy = 100% − (|Forecast − Actual| ÷ Actual × 100)
Example: You forecast $85,000. You closed $76,500.
- Error: 8,500 ÷ 76,500 = 11.1%
- Accuracy: 88.9%
Why it matters: Bad forecasts lead to bad inventory, hiring, and ad spend decisions. This is huge for ecommerce brands that buy stock ahead of time.
11. Net Revenue Retention (NRR)
What it is: How much revenue you keep and grow from existing accounts.
NRR = ((Starting revenue + Expansion − Downgrades − Churned revenue) ÷ Starting revenue) × 100
Example:
- Starting monthly revenue from accounts: $40,000
- Upsells: +$6,000
- Downgrades: −$1,000
- Lost accounts: −$3,000
- NRR: 42,000 ÷ 40,000 = 105%
Why it matters: Above 100% means your current customers grow revenue even with zero new sales.
12. Rep Ramp Time
What it is: How long a new rep takes to reach full productivity.
Ramp time = Total days for new reps to hit full quota ÷ Number of new reps
Example: Three reps took 60, 75, and 90 days. Ramp time = 75 days.
How to cut it: Written playbooks, call recordings, and a clear first 30-day plan.
13. Quota Participation Rate
What it is: The share of reps who hit their quota.
Participation rate = (Reps at or above quota ÷ Total reps) × 100
Example: 6 of 10 reps hit quota = 60%.
Why it matters: Your team can hit 100% of target because of one star rep. That is a risk. This KPI shows how spread out your results are.
14. Average Discount Rate
What it is: How much your team cuts from list price to close.
Discount rate = ((List price value − Sold value) ÷ List price value) × 100
Example: Deals worth $60,000 at list price closed for $54,000. Discount rate = 10%.
Warning sign: Discounts climb near month end. Reps are trading margin for quota.
15. Repeat Purchase Rate (for Ecommerce Teams)
What it is: The share of customers who buy more than once.
Repeat purchase rate = (Customers with 2+ orders ÷ Total customers) × 100
Example: 180 of 1,200 customers ordered again = 15%.
Why it matters: For DTC brands, repeat buyers make CLV grow. It is often cheaper to raise this than to lower CAC.
Which Sales KPIs Fit Your Business?
Not every team needs the same list. Use this table to pick.
| Business Type | Focus KPIs | Why |
|---|---|---|
| DTC Shopify brand | Conversion rate, average order value, CAC, repeat purchase rate, CLV | Sales happen online, so the funnel and repeat buyers matter most |
| B2B wholesale team | Win rate, deal size, cycle length, pipeline coverage, NRR | Fewer, bigger deals with longer cycles |
| Marketplace seller (Amazon, Walmart) | Conversion rate, average order value, CAC (ad spend based), repeat purchase rate | Ad costs and listing conversion drive profit |
| Inside sales or inbound team | Lead response time, conversion rate, quota attainment, participation rate | Speed and follow up decide results |
Sales KPIs by Role
Each person needs a different view. Do not give everyone the same dashboard.
| Role | Watch These KPIs | Review |
|---|---|---|
| Sales rep | Lead response time, conversion rate, own quota attainment | Daily |
| Sales manager | Win rate, cycle length, pipeline coverage, participation rate, ramp time | Weekly |
| Founder or CEO | Revenue vs. target, CAC, CLV, NRR, forecast accuracy | Monthly |
Sample Monthly Sales KPI Scorecard
Copy this format. Use your own targets.
| KPI | Target | Actual | Status |
|---|---|---|---|
| Quota attainment | 100% | 85% | Behind |
| Lead response time | Under 1 hour | 3 hours | Behind |
| Conversion rate | 8% | 8% | On track |
| Average deal size | $4,000 | $4,500 | Ahead |
| Sales cycle length | 30 days | 30 days | On track |
| CAC | Under $500 | $450 | Ahead |
| Win rate | 25% | 25% | On track |
| Pipeline coverage | 4x | 3x | Behind |
| Forecast accuracy | 90% | 88.9% | Watch |
How to read it: This team is behind on quota. But deal size and CAC look good. The real problems are slow lead replies and thin pipeline. That tells the manager exactly where to spend this week.
How to Set Targets for Each KPI
Do not copy targets from a blog post (including this one). Build them from your own data.
- Pull the last 90 days. This is your baseline.
- Set a small lift. Aim 5% to 10% above baseline for next quarter.
- Check the math. Make sure your KPI targets add up to your revenue goal. Use the pipeline velocity formula below to test it.
- Review every quarter. Raise targets that are too easy. Fix the process behind targets that are missed every month.
The Hidden Link: How These KPIs Work Together
Most articles treat each KPI on its own. But four of them combine into one number: pipeline velocity. It shows how much revenue your pipeline makes per day.
Pipeline velocity = (Qualified deals × Win rate × Average deal size) ÷ Sales cycle length
Example:
- 60 qualified deals
- 20% win rate
- $4,500 average deal
- 30-day cycle
Velocity = (60 × 0.20 × 4,500) ÷ 30 = $1,800 per day
Now try two fixes:
| Change | New Velocity | Gain |
|---|---|---|
| Win rate goes from 20% to 25% | $2,250 per day | +$450 per day |
| Cycle drops from 30 to 24 days | $2,250 per day | +$450 per day |
A +$450 daily gain is about $13,500 more in a 30-day month.
The lesson: Cutting 6 days from your cycle is worth the same as a 5 point jump in win rate. And the cycle fix is often easier.
The DIAL Review: A 20-Minute Weekly KPI Routine
Numbers do nothing on their own. Use this simple routine every Monday.
D: Diagnose
- Pull the 7 KPIs. Compare them to last week and last month.
- Circle anything that moved more than 10%.
I: Isolate
- Pick one KPI to fix this week. Just one.
- Find the stage, rep, or lead source causing the change.
A: Act
- Choose one action. Example: “Reply to all leads in under 30 minutes.”
- Name one owner and a due date.
L: Log
- Write down what you changed and the result.
- After 8 weeks, you have a playbook built from your own data.
When NOT to Rely on a KPI
KPIs can mislead you. Watch for these traps:
- Small numbers. A 50% win rate on 4 deals means little. Wait for more data.
- Quota attainment alone. A rep can hit quota with heavy discounts. Check margin too.
- CLV for new brands. Without two years of data, your “years as a customer” is a guess. Label it as one.
- Activity counts. 100 calls a day means nothing if conversion is falling.
Common Mistakes With Sales KPIs
- Tracking 20+ KPIs at once. Start with 7, then add bonus KPIs one at a time.
- Checking numbers only at month end.
- Setting targets with no link to past data.
- Using different formulas across teams.
- Rewarding activity instead of results.
How to Track Sales KPIs (Without Adding Work)
- Use one source of truth. Your CRM should hold every lead and deal.
- Build one dashboard. Show only the 7 KPIs above.
- Automate the data. Reps should not update spreadsheets by hand. Compare options in our list of sales automation tools.
- Forecast from the numbers. Use velocity and win rate to predict next month. Here is how AI-driven sales forecasting works.
- Assign an owner. Someone must run the DIAL review every week.
That last step is where most teams fail. Not because they lack tools. Because nobody owns the numbers.
Frequently Asked Questions
What are the most important sales KPIs to track?
The 7 most important sales KPIs are quota attainment, lead response time, lead-to-customer conversion rate, average deal size, sales cycle length, customer acquisition cost, and customer lifetime value.
How many sales KPIs should a team track?
Most sales teams should track 5 to 7 KPIs. More than that makes it hard to focus and act on the numbers.
What is the difference between a sales metric and a sales KPI?
A sales metric is any number you can measure, like calls made. A sales KPI is a metric tied to a business goal, like revenue closed against quota.
How often should you review sales KPIs?
Review lead response time daily, quota attainment and conversion rate weekly, deal size, cycle length, and CAC monthly, and customer lifetime value quarterly.
How do you calculate sales per rep?
Divide total sales by the number of sales reps. For example, $300,000 in sales across 5 reps equals $60,000 per rep.
What is the difference between win rate and conversion rate?
Conversion rate divides new customers by all leads. Win rate divides deals won by all deals that were won or lost. Win rate shows closing skill. Conversion rate shows the health of the whole funnel.
What is a good pipeline coverage ratio?
Many sales leaders aim for about 3 times the sales target. The right number depends on your win rate. A lower win rate needs more pipeline.
What are leading and lagging sales KPIs?
Leading KPIs, like lead response time and sales cycle length, predict future results. Lagging KPIs, like quota attainment and CAC, show results that already happened.
What is a good LTV to CAC ratio?
A ratio of 3 to 1 is a common target. It means a customer brings in three times what it cost to win them. Always check it against your own margins.
Stop Chasing Numbers. Build a System That Moves Them.
Tracking KPIs is easy. Improving them every week is the hard part.
That takes people who own the work: replying to leads fast, cleaning the CRM, following up on stuck deals, and running the review.
AcquireX builds dedicated sales teams that plug into your business. Not freelancers. Not a vendor you have to chase. A team that owns the numbers with you.
- Learn about our sales enablement and account growth services.
- See why brands choose sales team outsourcing to boost revenue.
Ready to hit your targets without the chaos? Book a free call with AcquireX.